
|
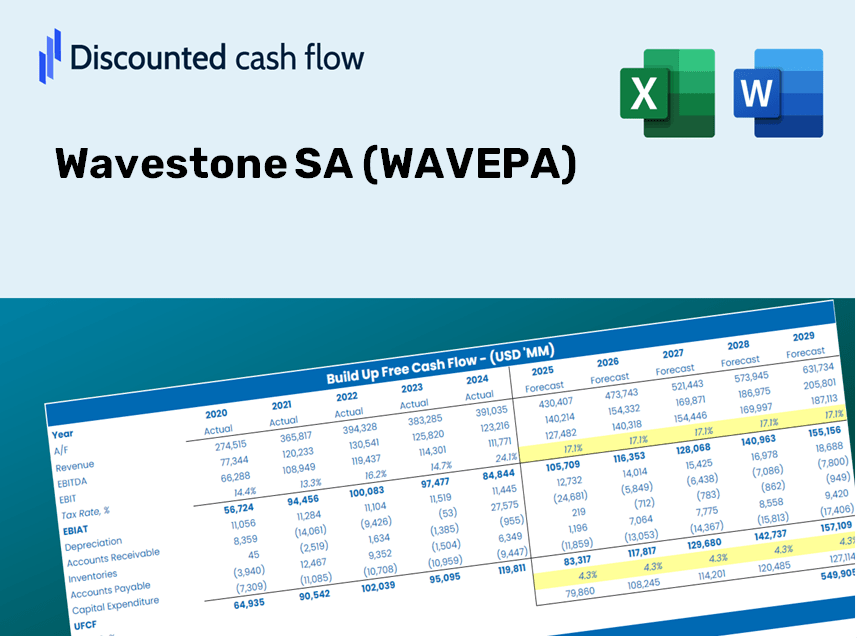
Wavestone SA (WAVE.PA) DCF Valuation |
Fully Editable: Tailor To Your Needs In Excel Or Sheets
Professional Design: Trusted, Industry-Standard Templates
Investor-Approved Valuation Models
MAC/PC Compatible, Fully Unlocked
No Expertise Is Needed; Easy To Follow
Wavestone SA (WAVE.PA) Bundle
Discover the true potential of Wavestone SA (WAVEPA) with our advanced DCF Calculator! Adjust critical assumptions, explore various scenarios, and evaluate how different changes affect Wavestone SA (WAVEPA) valuation – all within one comprehensive Excel template.
Discounted Cash Flow (DCF) - (USD MM)
| Year | AY1 2021 |
AY2 2022 |
AY3 2023 |
AY4 2024 |
AY5 2025 |
FY1 2026 |
FY2 2027 |
FY3 2028 |
FY4 2029 |
FY5 2030 |
|---|---|---|---|---|---|---|---|---|---|---|
| Revenue | 417.6 | 470.1 | 532.3 | 701.1 | 943.7 | 1,161.0 | 1,428.3 | 1,757.2 | 2,161.9 | 2,659.7 |
| Revenue Growth, % | 0 | 12.56 | 13.23 | 31.71 | 34.61 | 23.03 | 23.03 | 23.03 | 23.03 | 23.03 |
| EBITDA | 53.0 | 80.3 | 77.6 | 95.6 | 127.8 | 166.1 | 204.4 | 251.4 | 309.3 | 380.6 |
| EBITDA, % | 12.7 | 17.09 | 14.58 | 13.63 | 13.55 | 14.31 | 14.31 | 14.31 | 14.31 | 14.31 |
| Depreciation | 11.2 | 7.5 | 7.3 | 11.9 | 19.6 | 21.9 | 26.9 | 33.1 | 40.7 | 50.1 |
| Depreciation, % | 2.69 | 1.6 | 1.36 | 1.7 | 2.07 | 1.88 | 1.88 | 1.88 | 1.88 | 1.88 |
| EBIT | 41.8 | 72.8 | 70.3 | 83.6 | 108.3 | 144.2 | 177.5 | 218.3 | 268.6 | 330.5 |
| EBIT, % | 10.01 | 15.49 | 13.22 | 11.93 | 11.47 | 12.42 | 12.42 | 12.42 | 12.42 | 12.42 |
| Total Cash | 88.0 | 108.3 | 70.8 | 77.5 | 78.3 | 178.2 | 219.3 | 269.8 | 331.9 | 408.3 |
| Total Cash, percent | .0 | .0 | .0 | .0 | .0 | .0 | .0 | .0 | .0 | .0 |
| Account Receivables | 125.7 | 147.8 | 176.6 | 248.2 | 252.3 | 364.2 | 448.1 | 551.3 | 678.2 | 834.4 |
| Account Receivables, % | 30.1 | 31.43 | 33.18 | 35.41 | 26.74 | 31.37 | 31.37 | 31.37 | 31.37 | 31.37 |
| Inventories | .0 | .0 | .0 | .6 | .0 | .2 | .2 | .3 | .4 | .4 |
| Inventories, % | 0 | 0 | 0 | 0.08387347 | 0 | 0.01677469 | 0.01677469 | 0.01677469 | 0.01677469 | 0.01677469 |
| Accounts Payable | 11.6 | 12.6 | 14.7 | 42.3 | 34.2 | 41.5 | 51.0 | 62.8 | 77.2 | 95.0 |
| Accounts Payable, % | 2.77 | 2.68 | 2.77 | 6.03 | 3.62 | 3.57 | 3.57 | 3.57 | 3.57 | 3.57 |
| Capital Expenditure | -.7 | -.5 | -3.7 | -3.1 | -4.8 | -4.5 | -5.5 | -6.8 | -8.3 | -10.3 |
| Capital Expenditure, % | -0.17912 | -0.09679677 | -0.69608 | -0.44347 | -0.51268 | -0.38563 | -0.38563 | -0.38563 | -0.38563 | -0.38563 |
| Tax Rate, % | 26.8 | 26.8 | 26.8 | 26.8 | 26.8 | 26.8 | 26.8 | 26.8 | 26.8 | 26.8 |
| EBITAT | 26.1 | 51.7 | 51.4 | 59.9 | 79.3 | 101.3 | 124.6 | 153.3 | 188.7 | 232.1 |
| Depreciation | ||||||||||
| Changes in Account Receivables | ||||||||||
| Changes in Inventories | ||||||||||
| Changes in Accounts Payable | ||||||||||
| Capital Expenditure | ||||||||||
| UFCF | -77.6 | 37.7 | 28.2 | 24.1 | 82.4 | 13.9 | 71.7 | 88.2 | 108.5 | 133.5 |
| WACC, % | 8.76 | 8.79 | 8.8 | 8.79 | 8.8 | 8.79 | 8.79 | 8.79 | 8.79 | 8.79 |
| PV UFCF | ||||||||||
| SUM PV UFCF | 307.0 | |||||||||
| Long Term Growth Rate, % | 3.00 | |||||||||
| Free cash flow (T + 1) | 137 | |||||||||
| Terminal Value | 2,376 | |||||||||
| Present Terminal Value | 1,560 | |||||||||
| Enterprise Value | 1,867 | |||||||||
| Net Debt | 2 | |||||||||
| Equity Value | 1,864 | |||||||||
| Diluted Shares Outstanding, MM | 25 | |||||||||
| Equity Value Per Share | 75.87 |
What You Will Receive
- Pre-Filled Financial Model: Incorporates Wavestone SA’s actual data for accurate DCF valuation.
- Complete Forecasting Control: Modify revenue projections, profit margins, WACC, and other essential drivers.
- Real-Time Calculations: Automatic updates let you see immediate results as adjustments are made.
- Investor-Ready Template: A polished Excel file created for top-tier valuation analysis.
- Customizable and Reusable: Designed for adaptability, allowing for repeated use in comprehensive forecasting.
Key Features
- Real-Time Wavestone Data: Pre-loaded with Wavestone SA’s historical financial metrics and future projections.
- Comprehensive Customization Options: Tailor inputs such as revenue growth, profit margins, discount rates, tax implications, and capital investments.
- Adaptive Valuation Framework: Real-time adjustments to Net Present Value (NPV) and intrinsic value based on your personalized inputs.
- Scenario Analysis: Develop various forecasting scenarios to explore different valuation possibilities.
- Intuitive User Interface: Streamlined, organized, and accessible for both seasoned professionals and new users.
How It Works
- 1. Download the Template: Get the Excel file containing Wavestone SA's (WAVEPA) preloaded data.
- 2. Adjust Key Inputs: Modify essential parameters such as growth rates, WACC, and capital expenditures.
- 3. View Immediate Results: The DCF model automatically calculates the intrinsic value and NPV for you.
- 4. Explore Multiple Scenarios: Analyze different valuation outcomes by comparing various forecasts.
- 5. Present with Confidence: Deliver insightful valuation findings to strengthen your decision-making.
Why Opt for This Calculator?
- All-in-One Solution: Features DCF, WACC, and financial ratio analyses bundled together.
- Flexible Inputs: Modify yellow-highlighted cells to explore different scenarios.
- In-Depth Analysis: Automatically computes Wavestone SA’s intrinsic value and Net Present Value.
- Pre-filled Information: Includes historical and projected data for reliable starting points.
- Expert-Level Tool: Perfect for financial analysts, investors, and business consultants.
Who Can Benefit from Wavestone SA (WAVEPA)?
- Investors: Empower your investment strategies with a sophisticated valuation tool tailored for informed decision-making.
- Financial Analysts: Enhance your efficiency with a comprehensive DCF model that can be easily customized to suit your needs.
- Consultants: Seamlessly modify the template for impactful client presentations or detailed reports.
- Finance Enthusiasts: Broaden your knowledge of valuation methods through practical, real-world scenarios.
- Educators and Students: Utilize this resource as a hands-on learning aid in your finance courses.
Overview of Template Components
- Pre-Filled DCF Model: Wavestone SA’s financial data readily available for immediate application.
- WACC Calculator: Comprehensive calculations for the Weighted Average Cost of Capital.
- Financial Ratios: Assess Wavestone SA’s profitability, leverage, and operational efficiency.
- Editable Inputs: Adjust assumptions like growth rates, profit margins, and CAPEX to suit your analysis.
- Financial Statements: Access to annual and quarterly reports for thorough examination.
- Interactive Dashboard: Effortlessly visualize essential valuation metrics and outcomes.
Disclaimer
All information, articles, and product details provided on this website are for general informational and educational purposes only. We do not claim any ownership over, nor do we intend to infringe upon, any trademarks, copyrights, logos, brand names, or other intellectual property mentioned or depicted on this site. Such intellectual property remains the property of its respective owners, and any references here are made solely for identification or informational purposes, without implying any affiliation, endorsement, or partnership.
We make no representations or warranties, express or implied, regarding the accuracy, completeness, or suitability of any content or products presented. Nothing on this website should be construed as legal, tax, investment, financial, medical, or other professional advice. In addition, no part of this site—including articles or product references—constitutes a solicitation, recommendation, endorsement, advertisement, or offer to buy or sell any securities, franchises, or other financial instruments, particularly in jurisdictions where such activity would be unlawful.
All content is of a general nature and may not address the specific circumstances of any individual or entity. It is not a substitute for professional advice or services. Any actions you take based on the information provided here are strictly at your own risk. You accept full responsibility for any decisions or outcomes arising from your use of this website and agree to release us from any liability in connection with your use of, or reliance upon, the content or products found herein.