
|
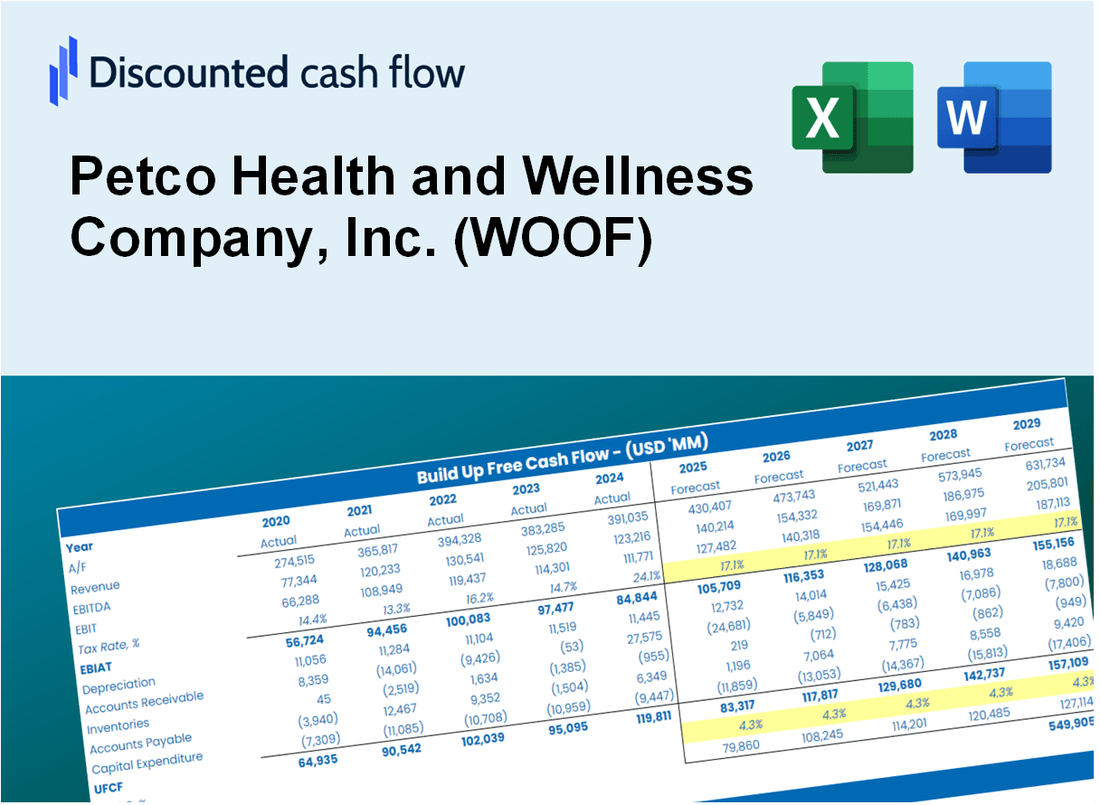
Petco Health and Wellness Company, Inc. (WOOF) DCF Valuation |
Fully Editable: Tailor To Your Needs In Excel Or Sheets
Professional Design: Trusted, Industry-Standard Templates
Investor-Approved Valuation Models
MAC/PC Compatible, Fully Unlocked
No Expertise Is Needed; Easy To Follow
Petco Health and Wellness Company, Inc. (WOOF) Bundle
Streamline your analysis and improve precision with our [WOOF] DCF Calculator! Utilizing real-time Petco data and customizable assumptions, this tool empowers you to forecast, analyze, and evaluate Petco Health and Wellness Company, Inc. like a seasoned investor.
What You Will Get
- Real WOOF Financial Data: Pre-filled with Petco's historical and projected data for precise analysis.
- Fully Editable Template: Modify key inputs like revenue growth, WACC, and EBITDA % with ease.
- Automatic Calculations: See Petco's intrinsic value update instantly based on your changes.
- Professional Valuation Tool: Designed for investors, analysts, and consultants seeking accurate DCF results.
- User-Friendly Design: Simple structure and clear instructions for all experience levels.
Key Features
- 🔍 Real-Life WOOF Financials: Pre-filled historical and projected data for Petco Health and Wellness Company, Inc.
- ✏️ Fully Customizable Inputs: Adjust all critical parameters (yellow cells) like WACC, growth %, and tax rates.
- 📊 Professional DCF Valuation: Built-in formulas calculate Petco’s intrinsic value using the Discounted Cash Flow method.
- ⚡ Instant Results: Visualize Petco’s valuation instantly after making changes.
- Scenario Analysis: Test and compare outcomes for various financial assumptions side-by-side.
How It Works
- Download: Get the ready-to-use Excel file featuring Petco Health and Wellness Company, Inc. (WOOF) financial data.
- Customize: Tailor your forecasts, including revenue growth, EBITDA %, and WACC.
- Update Automatically: Watch as intrinsic value and NPV calculations refresh in real-time.
- Test Scenarios: Develop various projections and compare results instantly.
- Make Decisions: Leverage the valuation outcomes to inform your investment strategy.
Why Choose Petco's Services?
- Save Time: Our platform eliminates the need for lengthy setup – it’s ready for immediate use.
- Enhance Accuracy: Access to reliable pet health data and insights minimizes errors in care decisions.
- Fully Customizable: Adjust services to meet the unique needs of your pets and preferences.
- Easy to Understand: Intuitive interfaces and clear information make navigation simple.
- Trusted by Pet Owners: Developed for those who prioritize their pets' health and well-being.
Who Should Use This Product?
- Investors: Evaluate Petco's valuation before making stock transactions.
- CFOs and Financial Analysts: Optimize valuation methodologies and assess financial forecasts.
- Startup Founders: Understand the valuation strategies of leading public companies like Petco.
- Consultants: Create comprehensive valuation reports for clients in the pet industry.
- Students and Educators: Utilize current data to practice and instruct on valuation methods.
What the Template Contains
- Pre-Filled Data: Includes Petco’s historical financials and forecasts.
- Discounted Cash Flow Model: Editable DCF valuation model with automatic calculations.
- Weighted Average Cost of Capital (WACC): A dedicated sheet for calculating WACC based on custom inputs.
- Key Financial Ratios: Analyze Petco’s profitability, efficiency, and leverage.
- Customizable Inputs: Edit revenue growth, margins, and tax rates with ease.
- Clear Dashboard: Charts and tables summarizing key valuation results.
Disclaimer
All information, articles, and product details provided on this website are for general informational and educational purposes only. We do not claim any ownership over, nor do we intend to infringe upon, any trademarks, copyrights, logos, brand names, or other intellectual property mentioned or depicted on this site. Such intellectual property remains the property of its respective owners, and any references here are made solely for identification or informational purposes, without implying any affiliation, endorsement, or partnership.
We make no representations or warranties, express or implied, regarding the accuracy, completeness, or suitability of any content or products presented. Nothing on this website should be construed as legal, tax, investment, financial, medical, or other professional advice. In addition, no part of this site—including articles or product references—constitutes a solicitation, recommendation, endorsement, advertisement, or offer to buy or sell any securities, franchises, or other financial instruments, particularly in jurisdictions where such activity would be unlawful.
All content is of a general nature and may not address the specific circumstances of any individual or entity. It is not a substitute for professional advice or services. Any actions you take based on the information provided here are strictly at your own risk. You accept full responsibility for any decisions or outcomes arising from your use of this website and agree to release us from any liability in connection with your use of, or reliance upon, the content or products found herein.