
|
WideOpenWest, Inc. (WOW) DCF Valuation |
Fully Editable: Tailor To Your Needs In Excel Or Sheets
Professional Design: Trusted, Industry-Standard Templates
Investor-Approved Valuation Models
MAC/PC Compatible, Fully Unlocked
No Expertise Is Needed; Easy To Follow
WideOpenWest, Inc. (WOW) Bundle
Discover the true value of WideOpenWest, Inc. (WOW) with our professional-grade DCF Calculator! Adjust key assumptions, explore various scenarios, and evaluate how changes affect WideOpenWest, Inc. (WOW) valuation – all within a single Excel template.
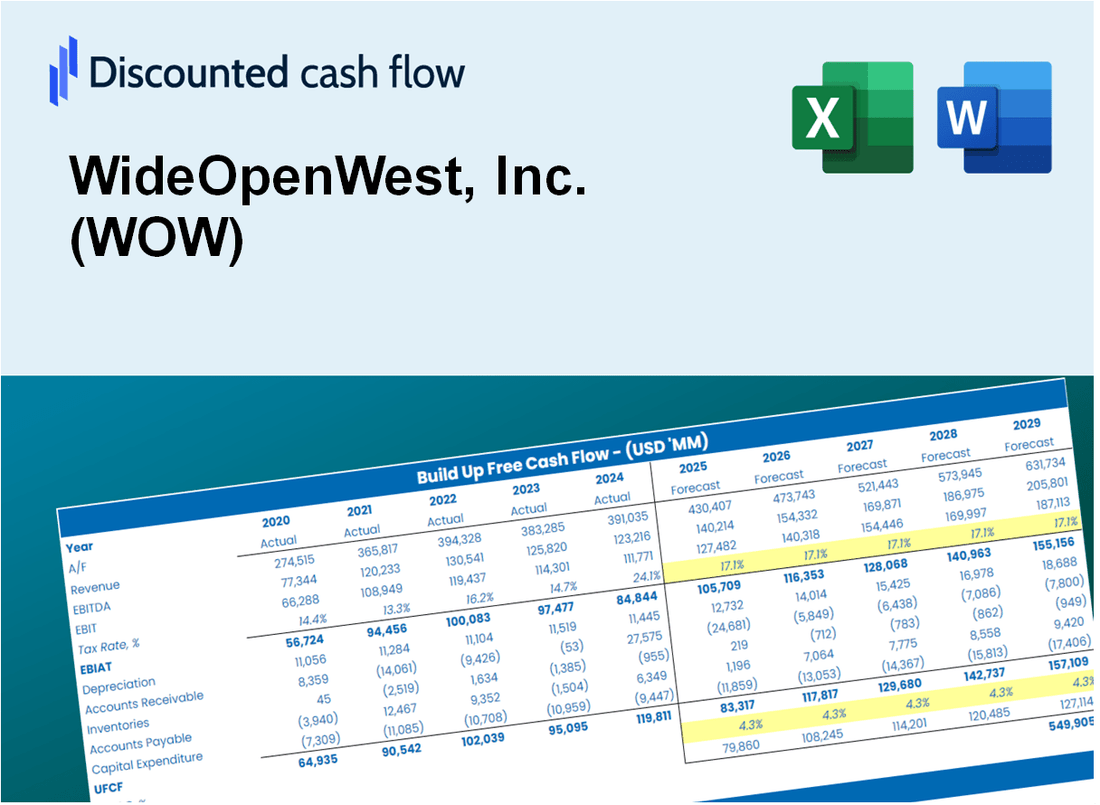
Discounted Cash Flow (DCF) - (USD MM)
| Year | AY1 2020 |
AY2 2021 |
AY3 2022 |
AY4 2023 |
AY5 2024 |
FY1 2025 |
FY2 2026 |
FY3 2027 |
FY4 2028 |
FY5 2029 |
|---|---|---|---|---|---|---|---|---|---|---|
| Revenue | 730.2 | 725.7 | 704.9 | 686.7 | 630.9 | 640.4 | 650.0 | 659.8 | 669.7 | 679.8 |
| Revenue Growth, % | 0 | -0.61627 | -2.87 | -2.58 | -8.13 | 1.5 | 1.5 | 1.5 | 1.5 | 1.5 |
| EBITDA | 221.7 | 221.4 | 195.2 | -119.2 | 216.5 | 135.1 | 137.2 | 139.2 | 141.3 | 143.5 |
| EBITDA, % | 30.36 | 30.51 | 27.69 | -17.36 | 34.32 | 21.1 | 21.1 | 21.1 | 21.1 | 21.1 |
| Depreciation | 230.6 | 210.3 | 179.3 | 193.5 | 210.0 | 188.9 | 191.7 | 194.6 | 197.5 | 200.5 |
| Depreciation, % | 31.58 | 28.98 | 25.44 | 28.18 | 33.29 | 29.49 | 29.49 | 29.49 | 29.49 | 29.49 |
| EBIT | -8.9 | 11.1 | 15.9 | -312.7 | 6.5 | -53.7 | -54.5 | -55.3 | -56.2 | -57.0 |
| EBIT, % | -1.22 | 1.53 | 2.26 | -45.54 | 1.03 | -8.39 | -8.39 | -8.39 | -8.39 | -8.39 |
| Total Cash | 12.4 | 193.2 | 31.0 | 23.4 | 38.8 | 54.1 | 55.0 | 55.8 | 56.6 | 57.5 |
| Total Cash, percent | .0 | .0 | .0 | .0 | .0 | .0 | .0 | .0 | .0 | .0 |
| Account Receivables | 47.2 | 58.1 | 52.1 | 48.3 | 34.1 | 43.9 | 44.6 | 45.3 | 45.9 | 46.6 |
| Account Receivables, % | 6.46 | 8.01 | 7.39 | 7.03 | 5.4 | 6.86 | 6.86 | 6.86 | 6.86 | 6.86 |
| Inventories | .0 | .0 | .0 | .0 | .0 | .0 | .0 | .0 | .0 | .0 |
| Inventories, % | 0 | 0 | 0 | 0 | 0 | 0 | 0 | 0 | 0 | 0 |
| Accounts Payable | 32.4 | 50.3 | 46.1 | 59.5 | 42.2 | 42.6 | 43.2 | 43.9 | 44.6 | 45.2 |
| Accounts Payable, % | 4.44 | 6.93 | 6.54 | 8.66 | 6.69 | 6.65 | 6.65 | 6.65 | 6.65 | 6.65 |
| Capital Expenditure | -234.1 | -207.7 | -167.2 | -268.9 | -215.8 | -202.1 | -205.1 | -208.2 | -211.3 | -214.5 |
| Capital Expenditure, % | -32.06 | -28.62 | -23.72 | -39.16 | -34.21 | -31.55 | -31.55 | -31.55 | -31.55 | -31.55 |
| Tax Rate, % | 28.38 | 28.38 | 28.38 | 28.38 | 28.38 | 28.38 | 28.38 | 28.38 | 28.38 | 28.38 |
| EBITAT | .9 | -103.8 | 1.7 | -234.4 | 4.7 | -16.9 | -17.2 | -17.4 | -17.7 | -18.0 |
| Depreciation | ||||||||||
| Changes in Account Receivables | ||||||||||
| Changes in Inventories | ||||||||||
| Changes in Accounts Payable | ||||||||||
| Capital Expenditure | ||||||||||
| UFCF | -17.4 | -94.2 | 15.6 | -292.6 | -4.2 | -39.6 | -30.6 | -31.1 | -31.5 | -32.0 |
| WACC, % | 2.22 | 2.22 | 2.88 | 6.76 | 6.55 | 4.13 | 4.13 | 4.13 | 4.13 | 4.13 |
| PV UFCF | ||||||||||
| SUM PV UFCF | -146.7 | |||||||||
| Long Term Growth Rate, % | 2.00 | |||||||||
| Free cash flow (T + 1) | -33 | |||||||||
| Terminal Value | -1,534 | |||||||||
| Present Terminal Value | -1,253 | |||||||||
| Enterprise Value | -1,400 | |||||||||
| Net Debt | 1,000 | |||||||||
| Equity Value | -2,400 | |||||||||
| Diluted Shares Outstanding, MM | 82 | |||||||||
| Equity Value Per Share | -29.32 |
What You Will Receive
- Pre-Filled Financial Model: WOW’s actual data allows for accurate DCF valuation.
- Full Forecast Control: Modify revenue growth, margins, WACC, and other essential drivers.
- Instant Calculations: Real-time updates ensure you see results as adjustments are made.
- Investor-Ready Template: A polished Excel file crafted for professional-level valuation.
- Customizable and Reusable: Designed for adaptability, enabling repeated use for in-depth forecasts.
Key Features
- 🔍 Real-Life WOW Financials: Pre-filled historical and projected data for WideOpenWest, Inc. (WOW).
- ✏️ Fully Customizable Inputs: Adjust all critical parameters (yellow cells) like WACC, growth %, and tax rates.
- 📊 Professional DCF Valuation: Built-in formulas calculate WideOpenWest’s intrinsic value using the Discounted Cash Flow method.
- ⚡ Instant Results: Visualize WideOpenWest’s valuation instantly after making changes.
- Scenario Analysis: Test and compare outcomes for various financial assumptions side-by-side.
How It Works
- Step 1: Download the Excel file.
- Step 2: Review WideOpenWest, Inc.'s (WOW) pre-filled financial data and forecasts.
- Step 3: Modify critical inputs such as revenue growth, WACC, and tax rates (highlighted cells).
- Step 4: Watch the DCF model update instantly as you adjust your assumptions.
- Step 5: Analyze the outputs and leverage the results for your investment decisions.
Why Choose This Calculator for WideOpenWest, Inc. (WOW)?
- Accurate Data: Real WideOpenWest financials provide dependable valuation results.
- Customizable: Modify key parameters such as growth rates, WACC, and tax rates to align with your forecasts.
- Time-Saving: Pre-built calculations save you the hassle of starting from the ground up.
- Professional-Grade Tool: Tailored for investors, analysts, and consultants.
- User-Friendly: Intuitive design and step-by-step guidance ensure ease of use for everyone.
Who Should Use This Product?
- Professional Investors: Develop comprehensive and accurate valuation models for portfolio assessments of WideOpenWest, Inc. (WOW).
- Corporate Finance Teams: Evaluate valuation scenarios to inform strategic decisions within the organization.
- Consultants and Advisors: Deliver precise valuation insights for clients interested in WideOpenWest, Inc. (WOW) stock.
- Students and Educators: Utilize real-world data to enhance learning and practice in financial modeling.
- Telecom Enthusiasts: Gain insights into how telecommunications companies like WideOpenWest, Inc. (WOW) are valued in the market.
What the Template Contains
- Comprehensive DCF Model: Editable template featuring detailed valuation calculations for WideOpenWest, Inc. (WOW).
- Real-World Data: Historical and projected financials for WideOpenWest, Inc. (WOW) preloaded for thorough analysis.
- Customizable Parameters: Modify WACC, growth rates, and tax assumptions to explore different scenarios.
- Financial Statements: Complete annual and quarterly breakdowns for enhanced insights into WideOpenWest, Inc. (WOW).
- Key Ratios: Integrated analysis for profitability, efficiency, and leverage specific to WideOpenWest, Inc. (WOW).
- Dashboard with Visual Outputs: Interactive charts and tables providing clear, actionable results for WideOpenWest, Inc. (WOW).
Disclaimer
All information, articles, and product details provided on this website are for general informational and educational purposes only. We do not claim any ownership over, nor do we intend to infringe upon, any trademarks, copyrights, logos, brand names, or other intellectual property mentioned or depicted on this site. Such intellectual property remains the property of its respective owners, and any references here are made solely for identification or informational purposes, without implying any affiliation, endorsement, or partnership.
We make no representations or warranties, express or implied, regarding the accuracy, completeness, or suitability of any content or products presented. Nothing on this website should be construed as legal, tax, investment, financial, medical, or other professional advice. In addition, no part of this site—including articles or product references—constitutes a solicitation, recommendation, endorsement, advertisement, or offer to buy or sell any securities, franchises, or other financial instruments, particularly in jurisdictions where such activity would be unlawful.
All content is of a general nature and may not address the specific circumstances of any individual or entity. It is not a substitute for professional advice or services. Any actions you take based on the information provided here are strictly at your own risk. You accept full responsibility for any decisions or outcomes arising from your use of this website and agree to release us from any liability in connection with your use of, or reliance upon, the content or products found herein.