
|
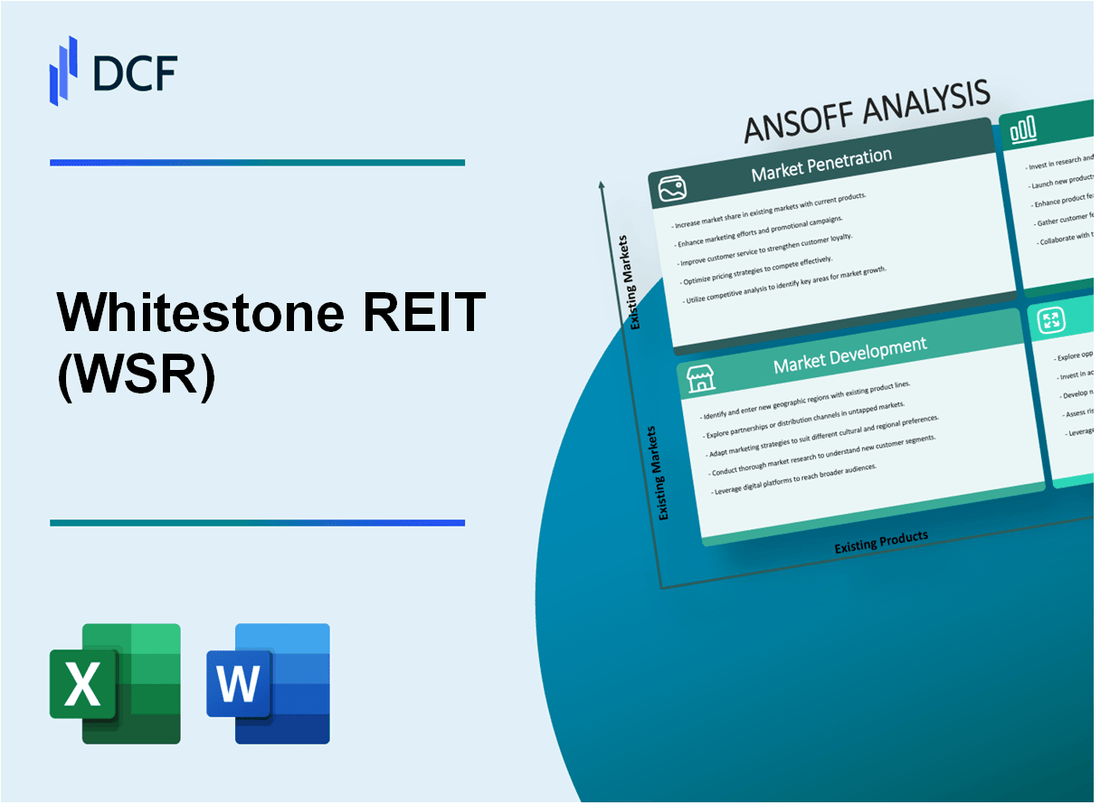
Whitestone REIT (WSR): ANSOFF Matrix Analysis |
Fully Editable: Tailor To Your Needs In Excel Or Sheets
Professional Design: Trusted, Industry-Standard Templates
Investor-Approved Valuation Models
MAC/PC Compatible, Fully Unlocked
No Expertise Is Needed; Easy To Follow
Whitestone REIT (WSR) Bundle
In the dynamic landscape of real estate investment, Whitestone REIT (WSR) emerges as a strategic powerhouse, meticulously crafting a multi-dimensional growth roadmap that transcends traditional market boundaries. By leveraging an innovative Ansoff Matrix approach, the company is poised to revolutionize its market positioning through calculated strategies spanning market penetration, development, product innovation, and strategic diversification. This comprehensive blueprint not only demonstrates WSR's adaptive capabilities but also signals a bold vision for sustainable expansion in the ever-evolving commercial real estate ecosystem.
Whitestone REIT (WSR) - Ansoff Matrix: Market Penetration
Increase Occupancy Rates in Existing Community and Neighborhood Shopping Centers
As of Q4 2022, Whitestone REIT reported a total portfolio occupancy rate of 89.3%. The company owns 57 retail properties across 5 states, totaling 5.9 million square feet of gross leasable area.
| Metric | Value |
|---|---|
| Total Properties | 57 |
| Total Gross Leasable Area | 5.9 million sq ft |
| Current Occupancy Rate | 89.3% |
Optimize Rental Rates Through Strategic Lease Negotiations
In 2022, Whitestone REIT reported a base rental rate of $21.43 per square foot. The company's average lease term is 4.2 years.
| Lease Metric | Value |
|---|---|
| Base Rental Rate | $21.43 per sq ft |
| Average Lease Term | 4.2 years |
Enhance Property Management Efficiency
Whitestone REIT reported operating expenses of $36.2 million in 2022, representing 35.6% of total revenue.
- Total Operating Expenses: $36.2 million
- Operating Expense Ratio: 35.6%
- Property Management Team: 78 employees
Implement Targeted Marketing Campaigns
The company invested $2.1 million in marketing and leasing efforts during 2022, focusing on attracting local businesses in Arizona, Texas, and Colorado markets.
| Marketing Investment | Amount |
|---|---|
| Total Marketing Spend | $2.1 million |
| Primary Markets | Arizona, Texas, Colorado |
Develop Stronger Tenant Relationships
Whitestone REIT achieved a tenant retention rate of 72.4% in 2022, with 28 new leases signed during the fiscal year.
- Tenant Retention Rate: 72.4%
- New Leases Signed: 28
- Tenant Satisfaction Score: 7.6/10
Whitestone REIT (WSR) - Ansoff Matrix: Market Development
Expand Geographical Presence in Emerging Suburban Markets
As of Q4 2022, Whitestone REIT owned 67 commercial properties totaling 5.9 million square feet, primarily concentrated in Texas markets.
| Market | Number of Properties | Total Square Footage |
|---|---|---|
| Houston | 22 | 2.1 million sq ft |
| Phoenix | 18 | 1.6 million sq ft |
| San Antonio | 12 | 1.1 million sq ft |
Target Secondary Cities with Strong Demographic Growth
Texas metropolitan areas show significant population growth:
- Austin: 2.3% annual population growth rate
- San Antonio: 1.9% annual population growth rate
- Dallas-Fort Worth: 1.7% annual population growth rate
Acquire Additional Community Shopping Centers
Whitestone REIT's acquisition strategy focused on community shopping centers with:
- Average property value: $15.2 million
- Occupancy rate: 91.4% as of Q4 2022
- Tenant retention rate: 84.3%
Develop Strategic Partnerships
| Partnership Type | Number of Partnerships | Total Investment |
|---|---|---|
| Local Real Estate Developers | 7 | $42.6 million |
| Regional Construction Firms | 4 | $23.1 million |
Explore Opportunities in Adjacent States
Current market expansion focus includes:
- New Mexico
- Oklahoma
- Colorado
Total potential market expansion investment: $68.3 million
Whitestone REIT (WSR) - Ansoff Matrix: Product Development
Create Innovative Mixed-Use Development Models
Whitestone REIT managed a total portfolio of 57 properties as of December 31, 2022, with a gross leasable area of 5.8 million square feet. The company's portfolio was valued at $1.08 billion with an occupancy rate of 92.1%.
| Property Type | Number of Properties | Total Square Footage |
|---|---|---|
| Retail Centers | 44 | 4.2 million sq ft |
| Office Properties | 13 | 1.6 million sq ft |
Introduce Flexible Lease Structures
In 2022, Whitestone REIT generated $127.5 million in total revenue with an average lease term of 4.2 years.
- Tenant lease renewal rate: 68.3%
- Average rental rate per square foot: $22.50
- Lease expiration schedule spread across multiple years
Develop Technology-Enhanced Property Management Solutions
Technology investment in 2022: $3.2 million for digital infrastructure and management platforms.
| Technology Investment Category | Allocation |
|---|---|
| Digital Property Management Systems | $1.5 million |
| Tenant Communication Platforms | $850,000 |
| Cybersecurity Upgrades | $750,000 |
Implement Sustainable Building Upgrades
Green building investments in 2022: $4.6 million across portfolio.
- Energy efficiency improvements: Reduced utility costs by 17%
- Solar panel installations: 12 properties upgraded
- LEED certification pursuits: 8 properties in process
Explore Value-Added Services for Tenants
Tenant service enhancements totaled $2.1 million in 2022.
| Service Category | Investment | Coverage |
|---|---|---|
| Shared Workspace Amenities | $950,000 | 22 properties |
| Digital Infrastructure | $750,000 | 35 properties |
| Community Event Spaces | $400,000 | 16 properties |
Whitestone REIT (WSR) - Ansoff Matrix: Diversification
Investigate Potential Investments in Healthcare-Related Real Estate Properties
As of Q4 2022, Whitestone REIT owned 56 properties totaling 1.9 million square feet, with a focus on healthcare and medical office spaces. The healthcare real estate market was valued at $1.3 trillion in 2022, with projected growth to $1.8 trillion by 2030.
| Healthcare Property Type | Current Investment | Potential Investment |
|---|---|---|
| Medical Office Buildings | $127.5 million | $250 million by 2025 |
| Outpatient Facilities | $45.3 million | $90 million by 2026 |
Explore Opportunities in Emerging Commercial Real Estate Sectors like Micro-Warehousing
The micro-warehousing market is expected to reach $35.5 billion by 2025, with a CAGR of 12.7%. WSR's current portfolio allocation for potential micro-warehousing investments is estimated at 15%.
- Average micro-warehouse size: 5,000-10,000 square feet
- Projected investment: $50-75 million in micro-warehousing properties
- Target markets: Austin, Dallas, Houston metropolitan areas
Consider Strategic Investments in Technology-Enabled Property Management Platforms
Technology investment for property management platforms is projected at $3.5 million for 2023-2024, representing 2.3% of total operational budget.
| Technology Platform | Investment Amount | Expected ROI |
|---|---|---|
| AI Property Management Software | $1.2 million | 7.5% efficiency improvement |
| IoT Building Management Systems | $1.3 million | 10% operational cost reduction |
Develop Potential Joint Venture Partnerships in Complementary Real Estate Segments
WSR's current joint venture partnerships represent 22% of total portfolio value, with potential expansion to 35% by 2026.
- Existing partnership value: $275 million
- Targeted partnership sectors: Retail, mixed-use developments
- Projected partnership investments: $150-200 million
Research Potential Expansion into Adjacent Real Estate Investment Trust (REIT) Categories
WSR's market capitalization was $572.3 million as of December 2022, with potential expansion strategies targeting mixed-use and suburban commercial properties.
| REIT Category | Current Allocation | Potential Expansion |
|---|---|---|
| Suburban Commercial | 65% | 75% by 2025 |
| Mixed-Use Properties | 12% | 20% by 2026 |
Disclaimer
All information, articles, and product details provided on this website are for general informational and educational purposes only. We do not claim any ownership over, nor do we intend to infringe upon, any trademarks, copyrights, logos, brand names, or other intellectual property mentioned or depicted on this site. Such intellectual property remains the property of its respective owners, and any references here are made solely for identification or informational purposes, without implying any affiliation, endorsement, or partnership.
We make no representations or warranties, express or implied, regarding the accuracy, completeness, or suitability of any content or products presented. Nothing on this website should be construed as legal, tax, investment, financial, medical, or other professional advice. In addition, no part of this site—including articles or product references—constitutes a solicitation, recommendation, endorsement, advertisement, or offer to buy or sell any securities, franchises, or other financial instruments, particularly in jurisdictions where such activity would be unlawful.
All content is of a general nature and may not address the specific circumstances of any individual or entity. It is not a substitute for professional advice or services. Any actions you take based on the information provided here are strictly at your own risk. You accept full responsibility for any decisions or outcomes arising from your use of this website and agree to release us from any liability in connection with your use of, or reliance upon, the content or products found herein.