
|
Whitestone REIT (WSR) DCF Valuation |
Fully Editable: Tailor To Your Needs In Excel Or Sheets
Professional Design: Trusted, Industry-Standard Templates
Investor-Approved Valuation Models
MAC/PC Compatible, Fully Unlocked
No Expertise Is Needed; Easy To Follow
Whitestone REIT (WSR) Bundle
Looking to determine the intrinsic value of Whitestone REIT? Our (WSR) DCF Calculator integrates real-world data with comprehensive customization features, allowing you to refine your forecasts and enhance your investment decisions.
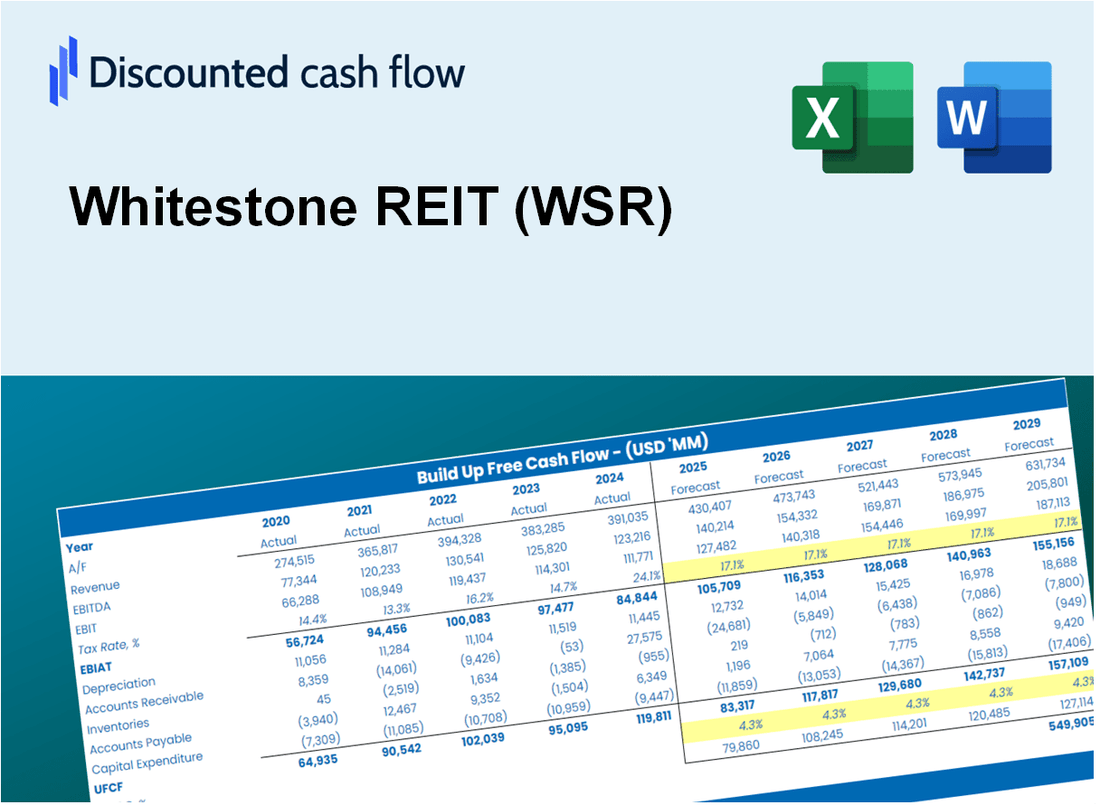
Discounted Cash Flow (DCF) - (USD MM)
| Year | AY1 2020 |
AY2 2021 |
AY3 2022 |
AY4 2023 |
AY5 2024 |
FY1 2025 |
FY2 2026 |
FY3 2027 |
FY4 2028 |
FY5 2029 |
|---|---|---|---|---|---|---|---|---|---|---|
| Revenue | 123.6 | 125.4 | 140.6 | 147.9 | 155.5 | 164.8 | 174.7 | 185.1 | 196.2 | 208.0 |
| Revenue Growth, % | 0 | 1.46 | 12.13 | 5.22 | 5.13 | 5.99 | 5.99 | 5.99 | 5.99 | 5.99 |
| EBITDA | 61.6 | 64.1 | 95.1 | 87.2 | 91.1 | 94.3 | 100.0 | 106.0 | 112.3 | 119.1 |
| EBITDA, % | 49.86 | 51.16 | 67.67 | 58.94 | 58.59 | 57.24 | 57.24 | 57.24 | 57.24 | 57.24 |
| Depreciation | 28.3 | 29.0 | 31.7 | 33.1 | 35.0 | 37.4 | 39.6 | 42.0 | 44.5 | 47.2 |
| Depreciation, % | 22.91 | 23.09 | 22.55 | 22.35 | 22.49 | 22.68 | 22.68 | 22.68 | 22.68 | 22.68 |
| EBIT | 33.3 | 35.2 | 63.4 | 54.1 | 56.1 | 57.0 | 60.4 | 64.0 | 67.8 | 71.9 |
| EBIT, % | 26.96 | 28.07 | 45.11 | 36.59 | 36.1 | 34.56 | 34.56 | 34.56 | 34.56 | 34.56 |
| Total Cash | 25.8 | 15.7 | 6.2 | 7.2 | 5.2 | 15.2 | 16.1 | 17.0 | 18.1 | 19.1 |
| Total Cash, percent | .0 | .0 | .0 | .0 | .0 | .0 | .0 | .0 | .0 | .0 |
| Account Receivables | 23.3 | 23.2 | 26.9 | 32.1 | 80.6 | 42.9 | 45.5 | 48.2 | 51.1 | 54.1 |
| Account Receivables, % | 18.89 | 18.54 | 19.17 | 21.7 | 51.86 | 26.03 | 26.03 | 26.03 | 26.03 | 26.03 |
| Inventories | .0 | .0 | .0 | .0 | .0 | .0 | .0 | .0 | .0 | .0 |
| Inventories, % | 0 | 0 | 0 | 0 | 0 | 0 | 0 | 0 | 0 | 0 |
| Accounts Payable | 31.0 | 32.3 | 28.5 | 28.8 | 40.6 | 38.5 | 40.8 | 43.2 | 45.8 | 48.5 |
| Accounts Payable, % | 25.08 | 25.78 | 20.24 | 19.47 | 26.14 | 23.34 | 23.34 | 23.34 | 23.34 | 23.34 |
| Capital Expenditure | .0 | .0 | .0 | .0 | .0 | .0 | .0 | .0 | .0 | .0 |
| Capital Expenditure, % | 0 | 0 | 0 | 0 | 0 | 0 | 0 | 0 | 0 | 0 |
| Tax Rate, % | 2.46 | 2.46 | 2.46 | 2.46 | 2.46 | 2.46 | 2.46 | 2.46 | 2.46 | 2.46 |
| EBITAT | 30.8 | 39.2 | 61.7 | 52.2 | 54.8 | 55.1 | 58.4 | 61.9 | 65.6 | 69.5 |
| Depreciation | ||||||||||
| Changes in Account Receivables | ||||||||||
| Changes in Inventories | ||||||||||
| Changes in Accounts Payable | ||||||||||
| Capital Expenditure | ||||||||||
| UFCF | 66.7 | 69.6 | 85.9 | 80.4 | 53.0 | 128.1 | 97.8 | 103.6 | 109.8 | 116.4 |
| WACC, % | 6.36 | 6.55 | 6.49 | 6.46 | 6.49 | 6.47 | 6.47 | 6.47 | 6.47 | 6.47 |
| PV UFCF | ||||||||||
| SUM PV UFCF | 462.9 | |||||||||
| Long Term Growth Rate, % | 3.50 | |||||||||
| Free cash flow (T + 1) | 120 | |||||||||
| Terminal Value | 4,057 | |||||||||
| Present Terminal Value | 2,965 | |||||||||
| Enterprise Value | 3,428 | |||||||||
| Net Debt | 627 | |||||||||
| Equity Value | 2,801 | |||||||||
| Diluted Shares Outstanding, MM | 51 | |||||||||
| Equity Value Per Share | 54.55 |
What You Will Get
- Editable Excel Template: A fully customizable Excel-based DCF Calculator featuring pre-filled real Whitestone REIT (WSR) financials.
- Real-World Data: Historical data and forward-looking estimates (as indicated in the highlighted cells).
- Forecast Flexibility: Adjust forecast assumptions such as revenue growth, EBITDA %, and WACC.
- Automatic Calculations: Quickly see how your inputs affect Whitestone REIT’s (WSR) valuation.
- Professional Tool: Designed for investors, CFOs, consultants, and financial analysts.
- User-Friendly Design: Organized for clarity and ease of use, complete with step-by-step guidance.
Key Features
- Comprehensive Data: Whitestone REIT’s (WSR) historical financial statements and pre-filled projections.
- Customizable Inputs: Modify WACC, tax rates, revenue growth, and EBITDA margins to fit your analysis.
- Real-Time Calculations: Instantly view Whitestone REIT’s (WSR) intrinsic value as you adjust inputs.
- Intuitive Visuals: Dashboard charts present valuation outcomes and essential metrics clearly.
- Designed for Precision: A reliable tool tailored for analysts, investors, and finance professionals.
How It Works
- Step 1: Download the Excel file for Whitestone REIT (WSR).
- Step 2: Review Whitestone REIT’s pre-filled financial data and projections.
- Step 3: Adjust key inputs such as rental income growth, capitalization rates, and occupancy rates (highlighted cells).
- Step 4: Observe the DCF model refresh in real-time as you modify assumptions.
- Step 5: Evaluate the outputs and leverage the findings for your investment strategies.
Why Choose This Calculator for Whitestone REIT (WSR)?
- Accuracy: Utilizes real Whitestone REIT financials to ensure precise data.
- Flexibility: Built for users to easily test and adjust inputs as needed.
- Time-Saving: Avoid the complexities of constructing a DCF model from the ground up.
- Professional-Grade: Crafted with the precision and usability expected by CFOs.
- User-Friendly: Intuitive design makes it accessible for users without extensive financial modeling skills.
Who Should Use This Product?
- Investors: Assess Whitestone REIT’s (WSR) value before making investment decisions.
- CFOs and Financial Analysts: Enhance valuation workflows and validate financial forecasts.
- Real Estate Entrepreneurs: Discover valuation methods used for established REITs like Whitestone REIT.
- Consultants: Provide detailed valuation analyses and reports for clients in real estate.
- Students and Educators: Utilize current market data to learn and teach valuation principles.
What the Template Contains
- Historical Data: Includes Whitestone REIT’s past financials and baseline forecasts.
- DCF and Levered DCF Models: Detailed templates to calculate Whitestone REIT’s intrinsic value.
- WACC Sheet: Pre-built calculations for Weighted Average Cost of Capital.
- Editable Inputs: Modify key drivers like growth rates, EBITDA %, and CAPEX assumptions.
- Quarterly and Annual Statements: A complete breakdown of Whitestone REIT’s financials.
- Interactive Dashboard: Visualize valuation results and projections dynamically.
Disclaimer
All information, articles, and product details provided on this website are for general informational and educational purposes only. We do not claim any ownership over, nor do we intend to infringe upon, any trademarks, copyrights, logos, brand names, or other intellectual property mentioned or depicted on this site. Such intellectual property remains the property of its respective owners, and any references here are made solely for identification or informational purposes, without implying any affiliation, endorsement, or partnership.
We make no representations or warranties, express or implied, regarding the accuracy, completeness, or suitability of any content or products presented. Nothing on this website should be construed as legal, tax, investment, financial, medical, or other professional advice. In addition, no part of this site—including articles or product references—constitutes a solicitation, recommendation, endorsement, advertisement, or offer to buy or sell any securities, franchises, or other financial instruments, particularly in jurisdictions where such activity would be unlawful.
All content is of a general nature and may not address the specific circumstances of any individual or entity. It is not a substitute for professional advice or services. Any actions you take based on the information provided here are strictly at your own risk. You accept full responsibility for any decisions or outcomes arising from your use of this website and agree to release us from any liability in connection with your use of, or reliance upon, the content or products found herein.