
|
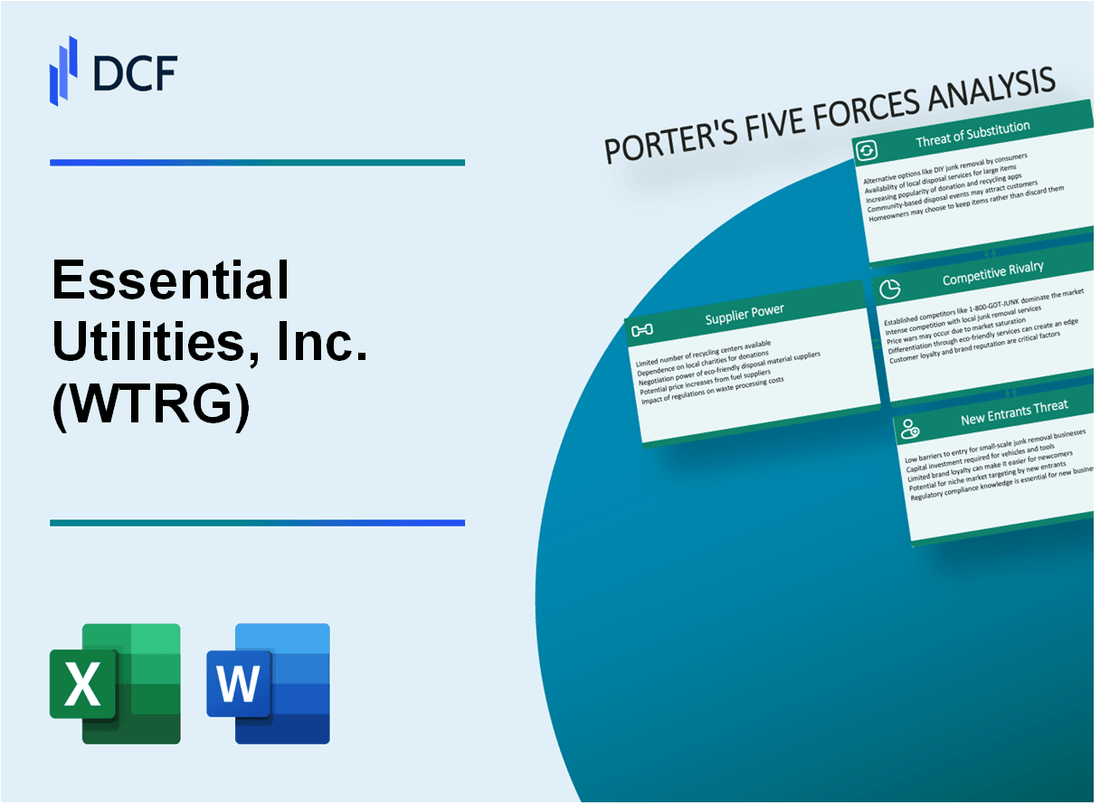
Essential Utilities, Inc. (WTRG): 5 FORCES Analysis [Nov-2025 Updated] |
Fully Editable: Tailor To Your Needs In Excel Or Sheets
Professional Design: Trusted, Industry-Standard Templates
Investor-Approved Valuation Models
MAC/PC Compatible, Fully Unlocked
No Expertise Is Needed; Easy To Follow
Essential Utilities, Inc. (WTRG) Bundle
You're looking for a clear-eyed view of Essential Utilities, Inc. (WTRG) through the lens of Porter's Five Forces, a framework that helps us map the competitive landscape and long-term profitability of this regulated utility business. Honestly, the analysis shows the classic utility moat: customer power is very low since pricing is dictated by state Public Utility Commissions, and the threat of new entrants is extremely low, given the massive capital requirements-think the planned $1.4 billion to $1.5 billion investment for 2025 alone. Still, while substitutes and direct rivalry are minimal in their service territories, we need to dig into the moderate power of specialized equipment suppliers and how active consolidation, like the proposed merger, is reshaping the competitive field. Dive in below to see the precise pressure points for this essential infrastructure player.
Essential Utilities, Inc. (WTRG) - Porter's Five Forces: Bargaining power of suppliers
You're looking at Essential Utilities, Inc. (WTRG) and trying to map out where the pressure points are with its vendors. For a utility making massive, long-term capital commitments, supplier power is a major factor you need to model correctly. Honestly, the power here leans toward moderate, driven by the highly specialized nature of the infrastructure required to keep water and gas flowing safely across nine states.
The sheer scale of Essential Utilities' required investment signals that suppliers of critical components hold significant leverage. The company is on track to invest between $1.4 billion and $1.5 billion in regulated infrastructure in 2025 alone. Looking out further, Essential Utilities has a five-year plan to invest approximately $7.8 billion through 2029 to upgrade its water and natural gas systems. This massive, sustained capital outlay means that when a specific piece of equipment is needed, Essential Utilities is a captive buyer for the duration of that project, which translates to high switching costs for those specific assets.
The need for bespoke, large-scale assets confirms supplier power. Consider the recent agreement to build an 18 million gallons per day (MGD) water treatment plant in Greene County, Pennsylvania. That's specialized engineering, not off-the-shelf parts. Furthermore, securing the necessary long-lead time equipment, like the gas turbines for the associated power plant, required Essential Utilities and its partner to lock in manufacturing slots with a delivery date set for 2028. That kind of lead time suggests very few, if any, viable alternative suppliers exist for that specific technology.
We can map out the key infrastructure spending areas where supplier power is most felt:
- Total planned infrastructure investment through 2029: $7.8 billion.
- Aqua's planned water/wastewater investment for 2025: roughly $790 million.
- Total planned water/wastewater investment through 2028: $3.2 billion.
- Water segment rate base projected CAGR through 2029: approximately 6%.
- Natural gas segment rate base projected CAGR through 2029: approximately 11%.
Still, supplier leverage isn't absolute. Regulatory bodies step in to constrain pricing power, which is a key check on suppliers in this industry. The urgent need for upgrades, highlighted by the ASCE's 2025 Report Card rating U.S. drinking water infrastructure at C- and wastewater systems at D+, forces Essential Utilities to spend, but the recovery of those costs is subject to commission approval. This regulatory environment means procurement decisions are scrutinized, which helps Essential Utilities negotiate terms, even if the equipment itself is specialized.
To counter potential price hikes from specialized vendors, Essential Utilities actively uses contractual mechanisms to manage costs, which is a smart move when dealing with capital-intensive procurement. Here's a look at how the company manages its financial footing while planning these major infrastructure buys:
| Financial Metric/Action | Value/Date | Context |
|---|---|---|
| Commercial Paper Program Ceiling | $1.0 billion | Established in May 2025 to reduce short-term borrowing costs for infrastructure. |
| Q1 2025 Revenue | $783.6 million | Shows the scale of operations funding these long-term supplier commitments. |
| Gas Turbine Delivery Target | 2028 | Example of a long-term commitment/secured manufacturing slot for a key component. |
| Acquisitions Since 2015 (Rate Base) | Over $548 million | Demonstrates growth that necessitates ongoing, large-scale equipment purchasing. |
The use of long-term agreements, like securing the 2028 turbine delivery slots, acts as a form of price lock-in, effectively reducing the immediate bargaining power a supplier might have on spot pricing. It's a trade-off: you give up flexibility for price certainty on mission-critical, long-lead items. For you, the analyst, this means supplier power is high on unique components but moderated by the utility's massive, predictable, long-term capital plan and regulatory oversight.
Essential Utilities, Inc. (WTRG) - Porter's Five Forces: Bargaining power of customers
You're analyzing Essential Utilities, Inc. (WTRG), and when you look at the customer side of the equation, the power dynamic is heavily skewed in the company's favor. Customer power is defintely very low here. Why? Because Essential Utilities, through its Aqua and Peoples brands, operates under a geographical monopoly for its regulated water, wastewater, and natural gas services across its service territories in states like Pennsylvania, Ohio, and Texas. Customers simply cannot switch providers for their essential water or gas supply; you can't easily move your house to get a different water utility. That lack of choice is the bedrock of low customer bargaining power.
Water and natural gas are, by their nature, essential services. This translates directly into inelastic demand for the core product. People need water to live and heat to survive the winter, so even if prices rise moderately, consumption doesn't drop off a cliff. For natural gas, studies on residential demand show price elasticity is low, with static own-price elasticity estimates falling between -0.271 and -0.486. This inelasticity means customers have little leverage to protest price increases through demand reduction alone. To be fair, extreme price spikes or a very warm winter can affect volume, as Essential Utilities saw when the first half of 2024 was 20% warmer than normal in its primary gas operating area, impacting revenues.
Crucially, pricing power rests not with the customer, but with the state Public Utility Commissions (PUCs). You don't negotiate your monthly bill with a salesperson; you negotiate with a regulatory body. Essential Utilities must file formal rate cases to recover capital investments and earn a return on its rate base. This process is formal, public, and time-consuming, which further limits the customer's ability to influence immediate pricing. For instance, Aqua Pennsylvania filed for a rate increase of $126.7 million per year in May 2024, its first in almost three years.
These rate cases are not an annual event; they are typically filed every few years, aligning with major capital expenditure cycles. The company is planning regulated infrastructure investments of $1.4 to $1.5 billion in 2025 alone, which must be recouped through these regulatory mechanisms. The frequency of these filings helps Essential Utilities manage its capital recovery, but it also means customers face rate adjustments in distinct, regulated steps rather than continuous, market-driven price changes.
Here's a look at some of the recent regulatory actions that dictate what customers ultimately pay:
| Jurisdiction/Segment | Regulatory Action/Filing | Annual Revenue Impact (Approximate) | Filing/Approval Timing |
|---|---|---|---|
| Aqua Pennsylvania (Water/Wastewater) | Rate Increase Request | $126.7 million | Filed May 2024; first in almost three years |
| Peoples Natural Gas (Gas) | PUC Approved Settlement | $93 million annualized increase | Approved following December 2023 filing |
| Regulated Water Segments (Various States) | Rate Awards/Infrastructure Surcharges (YTD 2025) | $86.3 million (PA, OH, NC) | Through Q1 2025 |
| Regulated Water Segments (Various States) | Base Rate Cases Pending (as of July 2025) | Estimated $96.5 million incremental revenue | Pending review |
| Regulated Water Segments (Various States) | Rate Awards/Infrastructure Surcharges (YTD Q2 2025) | $92.6 million | As of July 31, 2025 |
The impact of these approvals is concrete. If the Aqua Pennsylvania request were fully approved without change, a typical residential water customer using 3,870 gallons per month would see their bill rise from $80.91 to $97.01, an increase of about $16.10 monthly. Also, note that Essential Utilities serves approximately 7.5 million customers across its brands.
The customer's only real recourse, outside of the formal PUC process, is through the company's own customer service channels or through community advocacy groups that participate in the rate cases. The structure of the business-a regulated monopoly providing non-discretionary services-ensures that customer bargaining power remains minimal.
- Customer base: Approximately 7.5 million people served.
- Water customer growth: Expected 2% to 3% annual growth rate.
- Gas customer base: Expected to be stable for 2025.
- Dividend History: 80 consecutive years of dividend payments.
Essential Utilities, Inc. (WTRG) - Porter's Five Forces: Competitive rivalry
For Essential Utilities, Inc. (WTRG), competitive rivalry is structurally low in the specific service areas where it operates, which is typical for the water utility sector. This is because the business model is largely defined by a regulated monopoly structure within defined geographic territories. You don't see direct head-to-head competition for water delivery to a single residential customer.
However, the broader competitive landscape is defined by the highly fragmented nature of the U.S. water utility market. As of mid-2025, this landscape comprises approximately 48,858 community water systems (CWSs) serving the nation. This fragmentation creates a competitive environment focused on consolidation, where the rivalry shifts from service competition to acquisition competition.
Essential Utilities actively pursues this consolidation strategy to grow its regulated asset base and customer count. For instance, in 2023, Essential Utilities completed the acquisition of seven systems, which collectively added over $44 million in rate base and more than 11,000 customers to its footprint. This M&A focus has continued into 2025:
- Year-to-date 2025 acquisitions totaled an investment of approximately $58 million, integrating systems serving about 10,300 customers.
- Specific 2025 deals included the $18 million acquisition of Greenville Sanitary Authority's assets (serving approx. 2,300 customers) in January and the $37.75 million purchase of the City of Beaver Falls wastewater system in July.
The most significant competitive move is the announced all-stock merger with American Water Works Company, Inc. This transaction, based on closing stock prices as of October 24, 2025, creates a utility with a pro forma market capitalization of approximately $40 billion and a combined enterprise value of roughly $63 billion. The combined water and wastewater rate base is reported to be approximately $29.3 billion as of the end of 2024. This merger, if completed, would dramatically reshape the competitive field by creating a single, much larger regulated utility.
Essential Utilities competes for capital, talent, and acquisition targets against other large-cap utilities. Key rivals in the broader utility space include American Water Works (AWK) and Alliant Energy (LNT). To give you a sense of scale, as of November 27, 2025, American Water Works had a market capitalization of $25.3 billion. The rivalry here is about demonstrating superior growth prospects and financial stability to regulators and shareholders, especially when competing for the next acquisition target in the fragmented market.
| Metric | Essential Utilities (WTRG) Context | Competitor/Market Data |
|---|---|---|
| U.S. Water Utility Fragmentation (2025) | Rivalry focused on consolidation. | Approximately 48,858 Community Water Systems (CWSs). |
| 2023 Acquisition Activity | Active participation in consolidation. | Acquired seven systems adding over $44 million in rate base. |
| YTD 2025 Acquisition Activity | Continued focus on M&A. | Acquired systems serving approx. 10,300 customers for approx. $58 million. |
| Proposed Merger with AWK (Pro Forma) | Creates a dominant market player. | Combined water/wastewater rate base of approx. $29.3 billion (as of end-2024). |
| Proposed Merger Valuation (Oct 2025) | Creates a utility valued at $63 billion enterprise value. | Pro forma market capitalization of approx. $40 billion. |
| Key Large-Cap Rival Market Cap (Nov 2025) | Direct competitor in the consolidation race. | American Water Works (AWK) market cap of $25.3 billion. |
Essential Utilities, Inc. (WTRG) - Porter's Five Forces: Threat of substitutes
Threat is very low; there are no viable direct substitutes for piped water and wastewater service. Essential Utilities, Inc. (WTRG) serves approximately 7.5 million customers across its regulated water and gas operations as of late 2025. The core service of delivering potable water and managing wastewater is a non-discretionary, essential utility with no direct, scalable alternative for residential and commercial use.
Bottled water and home filtration systems are marginal alternatives, with municipal water costing only a fraction of the price. The average U.S. monthly water bill in 2025 is reported to be around $73, which translates to an estimated annual cost of $876 per household, with reported ranges from $20 to $105 monthly.
The cost disparity is stark when compared to bottled water, which can cost between $0.50 to $2.50 per bottle, leading to an annual expense of $183 to $913 for consuming just one bottle daily. By volume, bottled water can cost approximately $9.60 per gallon, while tap water costs pennies per gallon. Still, consumer concern over quality drives investment in home filtration, evidenced by the global Home Water Filtration Systems Market valuation reaching $25,389.4 million in 2025. The U.S. Home Water Filtration Unit Market alone was estimated at $20.26 billion in 2024.
| Substitute/Metric | 2025 Data Point | Source Context |
|---|---|---|
| Average Monthly Municipal Water Bill (US Est.) | $73 | The typical monthly water bill in the U.S. as of 2025. |
| Estimated Annual Municipal Water Cost (Based on Avg.) | $876 | Calculated from the $73 monthly average ($73 x 12). |
| Bottled Water Cost Per Year (1 bottle/day) | $183 to $913 | Range based on $0.50 to $2.50 per bottle. |
| Bottled Water Cost Per Gallon (Average Est.) | $9.60 | Average retail price translated to gallons. |
| Global Home Water Filtration Market Value (2025 Est.) | $25,389.4 million | Projected market valuation for the year. |
Natural gas faces a long-term, gradual substitution threat from electrification and renewables, though Essential Utilities, Inc. (WTRG)'s gas customer base is expected to be stable for 2025. In the electric power sector, natural gas is already losing ground, with its share of U.S. electricity generation forecast to drop to 40% in 2025 from 42% in 2024. Conversely, renewables are projected to increase their share to 24% in 2025 from 23% in 2024.
This transition is mandated in some operating areas; for instance, New York State has a goal for 70% of its energy needs to be met with renewables by 2030. Despite this, Essential Utilities, Inc. (WTRG) anticipates its regulated natural gas segment rate base will still grow at a compounded annual growth rate of approximately 11% through 2029.
Water scarcity and climate change increase the critical value of Essential Utilities' managed infrastructure. The company is committing significant capital to address these long-term needs:
- Planned infrastructure investment from 2025 through 2029: $7.8 billion.
- Capital projects allocated for PFAS remediation through 2029: at least $450 million.
- Projected compounded annual growth rate for the regulated water segment rate base through 2029: approximately 6%.
- Projected compounded annual growth rate for the combined regulated utility rate base through 2029: over 8%.
- Year-to-date 2025 investment in infrastructure: $983 million (as of Q3 2025).
Essential Utilities, Inc. (WTRG) - Porter's Five Forces: Threat of new entrants
You're looking at Essential Utilities, Inc. (WTRG) and wondering who could possibly jump into this space and compete. Honestly, the threat of new entrants is extremely low, practically non-existent, because the barriers to entry are monumental. We are talking about massive capital requirements and a regulatory moat that takes decades to build.
Think about the sheer scale. Essential Utilities is on track to invest between $1.4 billion and $1.5 billion in regulated infrastructure in 2025 alone. That's just one year for an established player. For a newcomer, the initial utility setup costs are staggering, often requiring tens of millions just to get started, with high infrastructure investment per mile being a constant drain on cash flow. The industry's overall need reinforces this; the U.S. Environmental Protection Agency estimates that $1.25 trillion in investments will be needed over the next 20 years for water and wastewater systems. The largest 15 regulated private water utilities already invest over $6 billion annually combined. You can see the capital required just to maintain the status quo.
| Metric | Essential Utilities (WTRG) 2025 Projection/Data | Industry Scale/Need (2025 Context) |
|---|---|---|
| 2025 Infrastructure Investment Target | $1.4 billion to $1.5 billion | NA |
| Long-Term Investment Plan (2025-2029) | $7.8 billion | NA |
| Total Estimated US Water/Wastewater Investment Need (Next 20 Years) | NA | $1.25 trillion to $1.26 trillion |
| Annual Investment by Top 15 Regulated Utilities | NA | Over $6 billion annually |
| Drinking Water Infrastructure Investment Gap (2024 Est.) | NA | $309 billion |
The regulatory environment acts as a powerful deterrent. New EPA PFAS regulations, for instance, create a significant, non-negotiable compliance cost. While the EPA extended the compliance deadline for PFOA and PFOS to 2031, the need for treatment upgrades remains. This regulatory pressure forces smaller, less capitalized municipal systems to seek acquisition by large players like Essential Utilities, who have the balance sheet to handle these mandates. Essential Utilities itself invested $27 million in PFAS mitigation in 2024.
Regulatory compliance expenses are substantial even outside of emerging contaminants. Look at the localized costs; in Chester County, Pennsylvania, Essential Utilities invested $4 million just to replace 450 customer-owned lead service lines at no cost to the homeowners. That kind of capital outlay for a single, localized compliance project is a major hurdle for any potential new entrant. The cost of navigating state-by-state utility commissions is another layer of complexity that favors incumbents.
The barriers to entry are clearly defined by capital and compliance:
- Massive upfront capital for pipeline and treatment setup.
- High, ongoing infrastructure investment required annually.
- Substantial, non-discretionary regulatory compliance spending.
- Extended PFAS compliance deadlines push small systems toward M&A.
- Navigating state-level Public Utility Commissions (PUCs) is complex.
Finance: model the potential acquisition premium for a small system with known PFAS liability by Q1 2026.
Disclaimer
All information, articles, and product details provided on this website are for general informational and educational purposes only. We do not claim any ownership over, nor do we intend to infringe upon, any trademarks, copyrights, logos, brand names, or other intellectual property mentioned or depicted on this site. Such intellectual property remains the property of its respective owners, and any references here are made solely for identification or informational purposes, without implying any affiliation, endorsement, or partnership.
We make no representations or warranties, express or implied, regarding the accuracy, completeness, or suitability of any content or products presented. Nothing on this website should be construed as legal, tax, investment, financial, medical, or other professional advice. In addition, no part of this site—including articles or product references—constitutes a solicitation, recommendation, endorsement, advertisement, or offer to buy or sell any securities, franchises, or other financial instruments, particularly in jurisdictions where such activity would be unlawful.
All content is of a general nature and may not address the specific circumstances of any individual or entity. It is not a substitute for professional advice or services. Any actions you take based on the information provided here are strictly at your own risk. You accept full responsibility for any decisions or outcomes arising from your use of this website and agree to release us from any liability in connection with your use of, or reliance upon, the content or products found herein.