
|
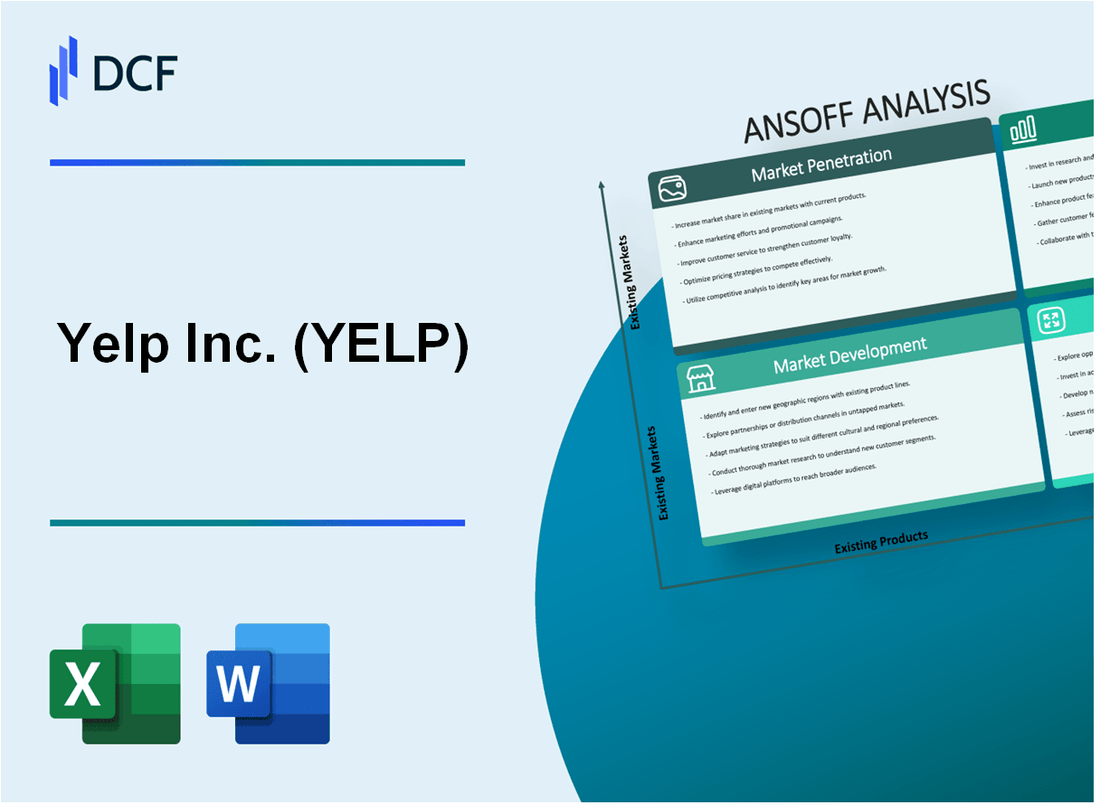
Yelp Inc. (YELP): ANSOFF MATRIX [Dec-2025 Updated] |
Fully Editable: Tailor To Your Needs In Excel Or Sheets
Professional Design: Trusted, Industry-Standard Templates
Investor-Approved Valuation Models
MAC/PC Compatible, Fully Unlocked
No Expertise Is Needed; Easy To Follow
Yelp Inc. (YELP) Bundle
You're looking for a clear-eyed view of Yelp Inc.'s growth trajectory as they aim for that $1.460 billion to $1.465 billion Net Revenue outlook for the full year 2025, and honestly, their strategy is mapped out across all four Ansoff quadrants. As an analyst who's tracked these local platforms for two decades, I see them focusing hard on Market Penetration-like boosting ROAS for their 512,000 paying advertisers-while simultaneously launching new Product Development, such as monetizing voice AI services. Still, the real long-term play involves Market Development overseas and even Diversification into B2B data services, so let's break down how these moves, from the $80 million RepairPal acquisition to leveraging 308 million reviews, translate into actual shareholder value below.
Yelp Inc. (YELP) - Ansoff Matrix: Market Penetration
You're looking at how Yelp Inc. can drive more revenue from its existing customer base and platform users. This is about squeezing more value out of the current market, which is generally the lowest-risk path for growth.
The foundation here is the existing advertiser base. In Q3 2025, Yelp reported 512,000 paying advertising locations. That number itself was down 2% year-over-year, so the immediate goal for market penetration is to reverse that decline and increase the spend per location. The Services category was the bright spot, with Services ad revenue hitting a record $243.8 million, a 7% year-over-year increase, while Restaurants, Retail, and Other (RR&O) revenue declined 2% year-over-year to $113.5 million. Total Net Revenue for Q3 2025 was a record $376 million.
To boost ad spend conversion, the focus must be on proving Return on Ad Spend (ROAS) for those 512,000 locations. The data shows that while ad clicks declined 11% year-over-year, the Average Cost-Per-Click (CPC) rose 14% year-over-year. This suggests advertisers are paying more for fewer clicks, meaning the quality or intent of the remaining clicks is high, or the optimization tools need work. Yelp rolled out over 35 new features, including AI-powered services like Yelp Host and Yelp Receptionist, which directly address this need for better optimization and conversion.
The integration of RepairPal, acquired for $80 million in cash, is a key lever here. Deepening this integration into the core auto services category helps shift ad revenue mix toward the higher-growth Services segment. For context, Services revenue grew 7% in Q3 2025, while RR&O declined.
Driving user engagement with the content base is critical for advertiser value. The platform has a massive pool of content to market to users, with reports indicating over 308 million cumulative reviews exist. Targeted performance marketing campaigns aim to increase the frequency with which users interact with this content, which directly translates to more valuable impressions and clicks for advertisers.
Here's a snapshot of the Q3 2025 financial context supporting these penetration efforts:
| Metric | Amount/Rate (Q3 2025) |
| Net Revenue | $376 million |
| Net Income | $39 million |
| Adjusted EBITDA | $98 million |
| Paying Advertising Locations | 512,000 |
| Services Ad Revenue | $243.8 million |
| RR&O Ad Revenue | $113.5 million |
| Ad Clicks Change YoY | Down 11% |
| Average CPC Change YoY | Up 14% |
To capture more wallet share from existing businesses, offering premium tiers is the next step. These tiers would monetize the advanced data Yelp collects. For example, the full-year 2025 Net Revenue outlook was updated to a midpoint of $1.460 billion to $1.465 billion, and the Adjusted EBITDA outlook midpoint was raised to $360 million to $365 million. New subscription revenue from premium tiers would directly support achieving or exceeding that $365 million Adjusted EBITDA target.
The focus on existing customers means maximizing the value derived from the 512,000 locations. You want every one of them spending more, not just retaining them.
- AI-powered tools introduced: Over 35 new features.
- RepairPal acquisition cost: $80 million.
- Services revenue growth: 7% year-over-year.
- Net Income Margin: 10%.
- Free Cash Flow: $118.9 million.
Finance: draft the expected incremental revenue from the top 10% of advertisers upgrading to the proposed premium tier by next Tuesday.
Yelp Inc. (YELP) - Ansoff Matrix: Market Development
You're looking at how Yelp Inc. takes its existing platform and ad products into new geographic territories. This is Market Development, and for a company with a strong US base, the next logical step is international expansion and deeper penetration in underserved US areas.
Here's a quick look at the financial backdrop as of late 2025, which funds this kind of expansion:
| Metric | Value (2025) | Period |
|---|---|---|
| Trailing Twelve Months (TTM) Revenue | $1.46 Billion USD | 2025 (TTM) |
| Net Revenue | $376 million | Q3 2025 |
| Net Revenue | $359 million | Q1 2025 |
| Adjusted EBITDA | $98 million | Q3 2025 |
| Free Cash Flow | $87.46 million | Q1 2025 |
Targeting major non-core English-speaking markets like Australia or the UK with the existing platform and ad products means leveraging a proven model where local advertising spend is significant. For context on the UK market, M&A activity in H1 2025 totaled £57.3bn, showing substantial capital movement, though this isn't Yelp Inc.'s direct revenue.
For US domestic expansion, the focus shifts to areas outside the high-density metros like New York or LA. While specific sales force headcount additions aren't public, the Services business has been a growth engine; Services revenue increased by 14% year over year in Q1 2025, suggesting successful monetization efforts that could be replicated in less saturated US markets.
Regarding strategic partnerships for content licensing via the Fusion AI API, you should know the platform already supports content across 32 countries. The Fusion AI API itself was introduced to bring Yelp's trusted content to third-party platforms via natural language search. While specific licensing deals with major international travel or booking platforms aren't detailed in recent filings, the existence of the API and its broad international data coverage sets the technical stage for such deals.
Launching a localized version of the Services marketplace in a high-growth, service-heavy economy like Mexico or Brazil is a clear Market Development play. Yelp Inc. has listed presence in both Mexico and Brazil in its geographic scope. This strategy would involve adapting the platform, which saw its Services revenue grow by 14% in Q1 2025, to local language, currency, and service provider needs. The rollout of AI-powered tools like Yelp Host, priced at $149 per month (or $99 with Guest Manager), shows a clear path to monetizing service interactions that could be immediately applied to new international service marketplaces.
You need to track international revenue segmentation, which isn't broken out granularly in the latest reports, but the overall TTM revenue of $1.46 Billion USD provides the scale from which these new markets must draw incremental growth.
Yelp Inc. (YELP) - Ansoff Matrix: Product Development
You're looking at how Yelp Inc. is building new revenue streams on its existing user base and business profile infrastructure. This is about shipping new software features that businesses pay for, moving beyond just selling ad space.
Monetize the new voice AI services, Yelp Host and Yelp Receptionist, through a subscription model for restaurants and services. The pricing structure for Yelp Host is set at $149 per month, or $99 for the Yelp Guest tier, directly targeting operational efficiency for table-service restaurants. This move into subscription-based AI tools supports the overall business performance, which saw record net revenue of $376.0 million in Q3 2025.
Expand the Yelp Assistant conversational AI to cover all major service categories, moving beyond initial home services focus. The Services segment is clearly the growth engine, with advertising revenue from these categories up 7% year-on-year in Q3 2025. The success of the AI-driven Yelp Assistant is evident, contributing to a 400% surge in project submissions through the tool. This indicates strong product-market fit within services, which is a key area for expansion.
Develop a full-suite, integrated Customer Relationship Management (CRM) tool for service pros directly on the Yelp for Business platform. The strategy here is to increase 'stickiness' for the 515,000 paying advertising locations as of mid-2025. By integrating CRM functions, Yelp aims to capture more of the service professional's workflow, which aligns with the Services segment driving 68% of advertising revenue share.
Introduce a premium data licensing product, Yelp Audiences, to drive off-platform ad clicks with publishing partners. While specific revenue from a dedicated data licensing product isn't detailed, the company's focus on data and AI suggests a push to monetize its vast user insights off-platform. The overall 2025 full-year net revenue guidance is set between $1.460 billion and $1.465 billion, showing the scale of the existing advertising business that such a product would augment.
Leverage Large Language Models (LLMs) to create dynamic, real-time business summaries for all 308 million reviews. The foundation for this is the massive corpus of user-generated content, with over 308 million Yelp reviews cumulatively recorded. The use of LLMs is already confirmed in features like Yelp Assistant, suggesting the technical capability to synthesize this data into real-time summaries for both consumers and businesses.
Here's a quick look at the recent financial and operational scale Yelp Inc. is operating within as it pushes these new products:
| Metric | Value (Latest Reported) | Context/Period |
| Q3 2025 Net Revenue | $376.0 million | Q3 2025 |
| 2025 Full-Year Revenue Guidance (High End) | $1.465 billion | Updated 2025 Outlook |
| Q3 2025 Net Income Margin | 10% | Q3 2025 |
| Cumulative Reviews | 308 million+ | As of late 2024/early 2025 |
| Paying Advertising Locations | 515,000 | As of mid-2025 |
| Yelp Host Monthly Subscription | $149 | Pricing for new AI service |
The success of these product developments hinges on adoption by the 7.74 million active business pages. If onboarding takes too long for these new AI tools, churn risk rises, defintely.
Finance: draft 13-week cash view by Friday.
Yelp Inc. (YELP) - Ansoff Matrix: Diversification
You're looking at Yelp Inc. (YELP) moving into entirely new product/market combinations, which is the riskiest quadrant of the Ansoff Matrix. This means taking what you know-connecting local businesses with consumers-and applying it to new data products, new geographies, or entirely new service models. Honestly, the company is already showing a clear pivot here, moving away from the more volatile restaurant and retail space toward services, which gives us a good baseline for what a true diversification effort might look like financially.
The most concrete evidence of a diversification strategy already in play is the acquisition of RepairPal for $80 million, specifically targeting the Home Services category. This move aligns with the broader strategic focus, as Services advertising revenue hit a quarterly record of $244 million in the third quarter of 2025, growing 7% year-over-year. Compare that to the Restaurant, Retail, and Other (RR&O) segment, which saw a 2% year-over-year decline to $114 million in the same quarter.
Here's a quick look at the revenue split in Q3 2025, showing where the current growth engine is:
| Segment | Q3 2025 Revenue (Millions USD) | Year-over-Year Change |
| Services Advertising | $244 | +7% |
| Restaurant, Retail & Other (RR&O) | $114 | -2% |
The success of the Services segment is clearly tied to product innovation. For instance, project submissions via Yelp Assistant grew nearly 400% year-over-year in Q3 2025, and request-to-quote projects rose approximately 10%.
Considering the proposed diversification vectors, here's how they map against Yelp Inc.'s current scale and focus:
- Launch a B2B data-as-a-service (DaaS) product selling anonymized local consumer trend data to financial institutions in Europe.
- Acquire a specialized vertical Software-as-a-Service (SaaS) company focused on inventory or logistics for small retailers in Asia.
- Develop a proprietary payment processing and point-of-sale (POS) system for local businesses in a new, unserved geographic region.
- Create a certified professional training and accreditation service for home service providers, monetized via a new B2C fee structure.
For the B2B Data-as-a-Service idea, you'd be looking to monetize the existing massive dataset. Yelp reported 7.74 million active business pages as of mid-2025, up 10% year-over-year. The entire company generated $376 million in net revenue in Q3 2025, with a net income margin of 10%. Any new DaaS revenue stream would need to scale significantly to move the needle against the full-year 2025 revenue guidance range of $1.460 billion to $1.465 billion.
The payment/POS system idea directly relates to the Services segment, which already has 512,000 paying advertising locations as of September 30, 2025. If a new POS system were adopted by even 10% of those locations, that's 51,200 new recurring revenue streams. The current Adjusted EBITDA for the whole company in Q3 2025 was $98 million, reflecting a 26% margin, showing the profitability potential of new, sticky offerings.
For the professional training and accreditation service, consider the existing user base: 29 million people use the Yelp app monthly. If a training course costs a flat fee of $499, capturing just 0.1% of the monthly active users who are service providers (a small subset of the 7.74 million pages) could generate substantial top-line revenue. The current focus on Home Services, which led growth with 15% year-over-year revenue growth in Q1 2025, suggests this is a fertile ground for new monetization.
Finance: draft 13-week cash view by Friday.
Disclaimer
All information, articles, and product details provided on this website are for general informational and educational purposes only. We do not claim any ownership over, nor do we intend to infringe upon, any trademarks, copyrights, logos, brand names, or other intellectual property mentioned or depicted on this site. Such intellectual property remains the property of its respective owners, and any references here are made solely for identification or informational purposes, without implying any affiliation, endorsement, or partnership.
We make no representations or warranties, express or implied, regarding the accuracy, completeness, or suitability of any content or products presented. Nothing on this website should be construed as legal, tax, investment, financial, medical, or other professional advice. In addition, no part of this site—including articles or product references—constitutes a solicitation, recommendation, endorsement, advertisement, or offer to buy or sell any securities, franchises, or other financial instruments, particularly in jurisdictions where such activity would be unlawful.
All content is of a general nature and may not address the specific circumstances of any individual or entity. It is not a substitute for professional advice or services. Any actions you take based on the information provided here are strictly at your own risk. You accept full responsibility for any decisions or outcomes arising from your use of this website and agree to release us from any liability in connection with your use of, or reliance upon, the content or products found herein.