
|
China Baoan Group Co., Ltd. (000009.SZ) Avaliação DCF |
Totalmente Editável: Adapte-Se Às Suas Necessidades No Excel Ou Planilhas
Design Profissional: Modelos Confiáveis E Padrão Da Indústria
Pré-Construídos Para Uso Rápido E Eficiente
Compatível com MAC/PC, totalmente desbloqueado
Não É Necessária Experiência; Fácil De Seguir
China Baoan Group Co., Ltd. (000009.SZ) Bundle
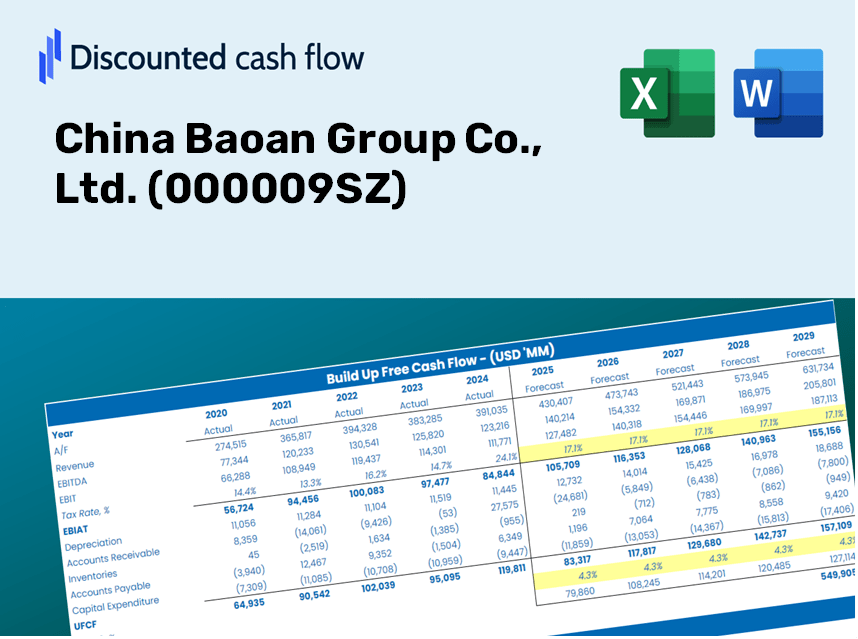
Avalie as perspectivas financeiras da China Baoan Group Co., Ltd. Como um especialista! Esta calculadora DCF (000009SZ) fornece finanças pré-preenchidas, juntamente com a flexibilidade para modificar o crescimento da receita, o WACC, as margens e outras suposições cruciais para se alinhar às suas projeções.
Discounted Cash Flow (DCF) - (USD MM)
| Year | AY1 2020 |
AY2 2021 |
AY3 2022 |
AY4 2023 |
AY5 2024 |
FY1 2025 |
FY2 2026 |
FY3 2027 |
FY4 2028 |
FY5 2029 |
|---|---|---|---|---|---|---|---|---|---|---|
| Revenue | 10,663.5 | 17,606.3 | 32,032.8 | 30,706.4 | 20,230.4 | 25,732.5 | 32,731.1 | 41,633.1 | 52,956.3 | 67,359.1 |
| Revenue Growth, % | 0 | 65.11 | 81.94 | -4.14 | -34.12 | 27.2 | 27.2 | 27.2 | 27.2 | 27.2 |
| EBITDA | 1,342.7 | 2,228.4 | 2,729.2 | 3,503.7 | 2,802.6 | 3,038.1 | 3,864.4 | 4,915.4 | 6,252.2 | 7,952.7 |
| EBITDA, % | 12.59 | 12.66 | 8.52 | 11.41 | 13.85 | 11.81 | 11.81 | 11.81 | 11.81 | 11.81 |
| Depreciation | 505.1 | 552.8 | 688.3 | 931.7 | 1,137.6 | 961.5 | 1,223.0 | 1,555.6 | 1,978.7 | 2,516.9 |
| Depreciation, % | 4.74 | 3.14 | 2.15 | 3.03 | 5.62 | 3.74 | 3.74 | 3.74 | 3.74 | 3.74 |
| EBIT | 837.6 | 1,675.6 | 2,040.9 | 2,572.0 | 1,664.9 | 2,076.6 | 2,641.4 | 3,359.7 | 4,273.5 | 5,435.8 |
| EBIT, % | 7.86 | 9.52 | 6.37 | 8.38 | 8.23 | 8.07 | 8.07 | 8.07 | 8.07 | 8.07 |
| Total Cash | 7,798.3 | 6,956.8 | 12,218.8 | 10,645.4 | 8,157.6 | 11,619.8 | 14,780.1 | 18,799.9 | 23,913.0 | 30,416.7 |
| Total Cash, percent | .0 | .0 | .0 | .0 | .0 | .0 | .0 | .0 | .0 | .0 |
| Account Receivables | 2,669.6 | 4,636.7 | 9,693.0 | 6,012.3 | 7,094.8 | 7,013.6 | 8,921.2 | 11,347.5 | 14,433.7 | 18,359.4 |
| Account Receivables, % | 25.03 | 26.34 | 30.26 | 19.58 | 35.07 | 27.26 | 27.26 | 27.26 | 27.26 | 27.26 |
| Inventories | 8,534.1 | 10,140.8 | 12,194.1 | 10,536.3 | 11,239.7 | 13,667.4 | 17,384.6 | 22,112.8 | 28,126.9 | 35,776.7 |
| Inventories, % | 80.03 | 57.6 | 38.07 | 34.31 | 55.56 | 53.11 | 53.11 | 53.11 | 53.11 | 53.11 |
| Accounts Payable | 2,903.9 | 4,314.3 | 10,820.3 | 6,574.5 | 7,849.2 | 7,499.8 | 9,539.5 | 12,134.0 | 15,434.2 | 19,631.9 |
| Accounts Payable, % | 27.23 | 24.5 | 33.78 | 21.41 | 38.8 | 29.15 | 29.15 | 29.15 | 29.15 | 29.15 |
| Capital Expenditure | -1,032.6 | -2,011.1 | -3,689.2 | -2,889.4 | -3,926.6 | -3,162.1 | -4,022.1 | -5,116.1 | -6,507.5 | -8,277.4 |
| Capital Expenditure, % | -9.68 | -11.42 | -11.52 | -9.41 | -19.41 | -12.29 | -12.29 | -12.29 | -12.29 | -12.29 |
| Tax Rate, % | 87.75 | 87.75 | 87.75 | 87.75 | 87.75 | 87.75 | 87.75 | 87.75 | 87.75 | 87.75 |
| EBITAT | 389.5 | 803.9 | 823.0 | 867.0 | 204.0 | 750.8 | 955.0 | 1,214.7 | 1,545.1 | 1,965.3 |
| Depreciation | ||||||||||
| Changes in Account Receivables | ||||||||||
| Changes in Inventories | ||||||||||
| Changes in Accounts Payable | ||||||||||
| Capital Expenditure | ||||||||||
| UFCF | -8,437.7 | -2,817.9 | -2,781.3 | 1.9 | -3,096.1 | -4,145.9 | -5,429.2 | -6,905.8 | -8,783.9 | -11,173.0 |
| WACC, % | 5.93 | 5.95 | 5.85 | 5.77 | 5.49 | 5.8 | 5.8 | 5.8 | 5.8 | 5.8 |
| PV UFCF | ||||||||||
| SUM PV UFCF | -30,038.9 | |||||||||
| Long Term Growth Rate, % | 2.00 | |||||||||
| Free cash flow (T + 1) | -11,396 | |||||||||
| Terminal Value | -299,919 | |||||||||
| Present Terminal Value | -226,245 | |||||||||
| Enterprise Value | -256,284 | |||||||||
| Net Debt | 6,647 | |||||||||
| Equity Value | -262,931 | |||||||||
| Diluted Shares Outstanding, MM | 2,580 | |||||||||
| Equity Value Per Share | -101.90 |
What You Will Receive
- Pre-Loaded Financial Model: Utilize China Baoan Group Co., Ltd.'s (000009SZ) actual data for accurate DCF valuation.
- Comprehensive Forecast Control: Modify revenue growth, margins, WACC, and other critical metrics as needed.
- Real-Time Calculations: Instant updates allow you to see the impact of your adjustments immediately.
- Investor-Ready Template: A polished Excel file crafted for high-quality valuation presentations.
- Flexible and Reusable: Designed for versatility, making it easy to reuse for in-depth forecasts.
Key Features
- 🔍 Real-Life 000009SZ Financials: Pre-filled historical and projected data for China Baoan Group Co., Ltd.
- ✏️ Fully Customizable Inputs: Modify all essential parameters (yellow cells) such as WACC, growth %, and tax rates.
- 📊 Professional DCF Valuation: Built-in formulas assess China Baoan's intrinsic value using the Discounted Cash Flow method.
- ⚡ Instant Results: Visualize the valuation of China Baoan immediately after adjustments.
- Scenario Analysis: Evaluate and compare potential outcomes for different financial assumptions side-by-side.
How It Works
- Step 1: Download the Excel file.
- Step 2: Examine China Baoan Group Co., Ltd.'s pre-filled financial data and projections.
- Step 3: Adjust key inputs such as revenue growth, WACC, and tax rates (highlighted cells).
- Step 4: Observe the DCF model update in real-time as you modify your assumptions.
- Step 5: Evaluate the outputs and leverage the results for your investment strategies.
Why Opt for China Baoan Group Co., Ltd. ([000009SZ])?
- Time Efficiency: Skip the hassle of building complex models – our resources are readily available.
- Enhanced Precision: Dependable financial insights and formulas minimize valuation errors.
- Completely Customizable: Adjust the model to align with your specific assumptions and forecasts.
- User-Friendly Design: Intuitive charts and outputs facilitate straightforward analysis of results.
- Endorsed by Professionals: Crafted for industry experts who prioritize accuracy and ease of use.
Who Can Benefit from This Product?
- Investors: Evaluate the valuation of China Baoan Group Co., Ltd. (000009SZ) prior to making stock transactions.
- CFOs and Financial Analysts: Optimize valuation workflows and assess financial forecasts.
- Startup Founders: Gain insights into how prominent companies like China Baoan Group Co., Ltd. (000009SZ) are appraised.
- Consultants: Provide comprehensive valuation reports for your clients.
- Students and Educators: Utilize real-time data to practice and instruct on valuation methodologies.
What the Template Includes
- Pre-Filled DCF Model: China Baoan Group’s financial data preloaded for immediate analysis.
- WACC Calculator: Comprehensive calculations for Weighted Average Cost of Capital.
- Financial Ratios: Assess China Baoan Group’s profitability, leverage, and operational efficiency.
- Editable Inputs: Modify assumptions such as growth rates, margins, and CAPEX to suit your modeling needs.
- Financial Statements: Access annual and quarterly reports for in-depth analysis.
- Interactive Dashboard: Easily visualize essential valuation metrics and outcomes.
Disclaimer
All information, articles, and product details provided on this website are for general informational and educational purposes only. We do not claim any ownership over, nor do we intend to infringe upon, any trademarks, copyrights, logos, brand names, or other intellectual property mentioned or depicted on this site. Such intellectual property remains the property of its respective owners, and any references here are made solely for identification or informational purposes, without implying any affiliation, endorsement, or partnership.
We make no representations or warranties, express or implied, regarding the accuracy, completeness, or suitability of any content or products presented. Nothing on this website should be construed as legal, tax, investment, financial, medical, or other professional advice. In addition, no part of this site—including articles or product references—constitutes a solicitation, recommendation, endorsement, advertisement, or offer to buy or sell any securities, franchises, or other financial instruments, particularly in jurisdictions where such activity would be unlawful.
All content is of a general nature and may not address the specific circumstances of any individual or entity. It is not a substitute for professional advice or services. Any actions you take based on the information provided here are strictly at your own risk. You accept full responsibility for any decisions or outcomes arising from your use of this website and agree to release us from any liability in connection with your use of, or reliance upon, the content or products found herein.