
|
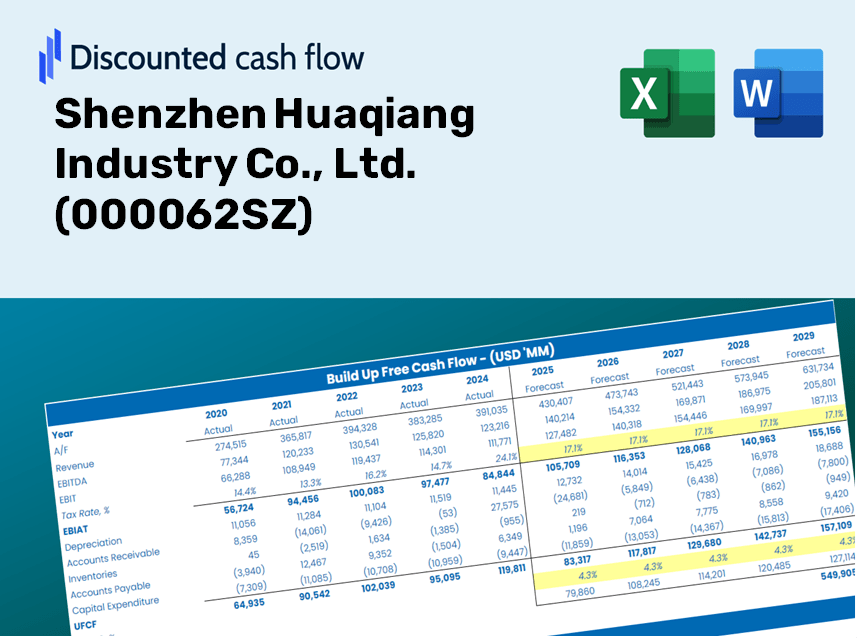
Shenzhen Huaqiang Industry Co., Ltd. (000062.sz) DCF Avaliação |
Totalmente Editável: Adapte-Se Às Suas Necessidades No Excel Ou Planilhas
Design Profissional: Modelos Confiáveis E Padrão Da Indústria
Pré-Construídos Para Uso Rápido E Eficiente
Compatível com MAC/PC, totalmente desbloqueado
Não É Necessária Experiência; Fácil De Seguir
Shenzhen Huaqiang Industry Co., Ltd. (000062.SZ) Bundle
Descubra o verdadeiro valor da Shenzhen Huaqiang Industry Co., Ltd. (000062SZ) com nossa calculadora DCF de nível profissional! Ajustar as suposições essenciais, explorar vários cenários e avaliar o impacto das mudanças na avaliação da Indústria de Shenzhen Huaqiang, Ltd. (000062SZ) - tudo dentro de um único modelo do Excel.
Discounted Cash Flow (DCF) - (USD MM)
| Year | AY1 2020 |
AY2 2021 |
AY3 2022 |
AY4 2023 |
AY5 2024 |
FY1 2025 |
FY2 2026 |
FY3 2027 |
FY4 2028 |
FY5 2029 |
|---|---|---|---|---|---|---|---|---|---|---|
| Revenue | 16,331.0 | 22,840.6 | 23,941.3 | 20,593.7 | 21,953.7 | 24,001.0 | 26,239.1 | 28,686.0 | 31,361.0 | 34,285.5 |
| Revenue Growth, % | 0 | 39.86 | 4.82 | -13.98 | 6.6 | 9.33 | 9.33 | 9.33 | 9.33 | 9.33 |
| EBITDA | 1,094.6 | 1,595.4 | 1,463.5 | 1,088.2 | 810.1 | 1,381.2 | 1,510.1 | 1,650.9 | 1,804.8 | 1,973.1 |
| EBITDA, % | 6.7 | 6.98 | 6.11 | 5.28 | 3.69 | 5.75 | 5.75 | 5.75 | 5.75 | 5.75 |
| Depreciation | 134.8 | 147.9 | 164.1 | 145.1 | 186.6 | 178.3 | 194.9 | 213.1 | 232.9 | 254.6 |
| Depreciation, % | 0.82561 | 0.64764 | 0.68562 | 0.70467 | 0.85011 | 0.74273 | 0.74273 | 0.74273 | 0.74273 | 0.74273 |
| EBIT | 959.8 | 1,447.5 | 1,299.3 | 943.1 | 623.5 | 1,203.0 | 1,315.2 | 1,437.8 | 1,571.9 | 1,718.5 |
| EBIT, % | 5.88 | 6.34 | 5.43 | 4.58 | 2.84 | 5.01 | 5.01 | 5.01 | 5.01 | 5.01 |
| Total Cash | 1,846.1 | 2,537.7 | 3,215.9 | 3,324.5 | 3,229.4 | 3,201.7 | 3,500.3 | 3,826.7 | 4,183.6 | 4,573.7 |
| Total Cash, percent | .0 | .0 | .0 | .0 | .0 | .0 | .0 | .0 | .0 | .0 |
| Account Receivables | 4,345.5 | 5,064.8 | 4,774.6 | 6,267.2 | 6,048.5 | 6,082.3 | 6,649.5 | 7,269.6 | 7,947.5 | 8,688.6 |
| Account Receivables, % | 26.61 | 22.17 | 19.94 | 30.43 | 27.55 | 25.34 | 25.34 | 25.34 | 25.34 | 25.34 |
| Inventories | 1,523.9 | 2,991.5 | 2,859.1 | 2,663.0 | 2,955.5 | 2,916.8 | 3,188.8 | 3,486.2 | 3,811.3 | 4,166.7 |
| Inventories, % | 9.33 | 13.1 | 11.94 | 12.93 | 13.46 | 12.15 | 12.15 | 12.15 | 12.15 | 12.15 |
| Accounts Payable | 687.7 | 788.2 | 664.6 | 1,082.5 | 1,780.6 | 1,142.7 | 1,249.2 | 1,365.7 | 1,493.1 | 1,632.3 |
| Accounts Payable, % | 4.21 | 3.45 | 2.78 | 5.26 | 8.11 | 4.76 | 4.76 | 4.76 | 4.76 | 4.76 |
| Capital Expenditure | -173.1 | -368.4 | -317.3 | -116.6 | -74.4 | -235.4 | -257.3 | -281.3 | -307.5 | -336.2 |
| Capital Expenditure, % | -1.06 | -1.61 | -1.33 | -0.56642 | -0.33911 | -0.98065 | -0.98065 | -0.98065 | -0.98065 | -0.98065 |
| Tax Rate, % | 43.15 | 43.15 | 43.15 | 43.15 | 43.15 | 43.15 | 43.15 | 43.15 | 43.15 | 43.15 |
| EBITAT | 678.1 | 958.5 | 960.4 | 633.1 | 354.5 | 805.4 | 880.6 | 962.7 | 1,052.4 | 1,150.6 |
| Depreciation | ||||||||||
| Changes in Account Receivables | ||||||||||
| Changes in Inventories | ||||||||||
| Changes in Accounts Payable | ||||||||||
| Capital Expenditure | ||||||||||
| UFCF | -4,541.9 | -1,348.3 | 1,106.3 | -217.1 | 1,091.0 | 115.3 | 85.5 | 93.5 | 102.2 | 111.7 |
| WACC, % | 5.87 | 5.84 | 5.9 | 5.85 | 5.78 | 5.85 | 5.85 | 5.85 | 5.85 | 5.85 |
| PV UFCF | ||||||||||
| SUM PV UFCF | 429.6 | |||||||||
| Long Term Growth Rate, % | 3.50 | |||||||||
| Free cash flow (T + 1) | 116 | |||||||||
| Terminal Value | 4,927 | |||||||||
| Present Terminal Value | 3,708 | |||||||||
| Enterprise Value | 4,138 | |||||||||
| Net Debt | 3,299 | |||||||||
| Equity Value | 838 | |||||||||
| Diluted Shares Outstanding, MM | 1,046 | |||||||||
| Equity Value Per Share | 0.80 |
What You Will Receive
- Customizable Excel Template: A fully editable Excel-based DCF Calculator featuring pre-loaded financial data for Shenzhen Huaqiang Industry Co., Ltd. (000062SZ).
- Accurate Data: Access to historical financial performance and forward-looking projections (highlighted in the yellow cells).
- Adjustable Forecasts: Modify key assumptions such as revenue growth, EBITDA percentages, and WACC to suit your analysis.
- Instant Calculations: Quickly observe how your inputs affect the valuation of Shenzhen Huaqiang Industry Co., Ltd. (000062SZ).
- Professional Resource: Designed for use by investors, CFOs, consultants, and financial analysts.
- User-Friendly Interface: Organized for ease of understanding and navigation, complete with detailed step-by-step guidance.
Key Features
- Advanced DCF Calculator: Comprehensive unlevered and levered DCF valuation models tailored for Shenzhen Huaqiang Industry Co., Ltd. (000062SZ).
- WACC Calculator: Pre-configured Weighted Average Cost of Capital sheet with adaptable inputs specific to the company.
- Customizable Forecast Assumptions: Adjust growth rates, capital expenditures, and discount rates to fit your analysis needs.
- Integrated Financial Ratios: Evaluate profitability, leverage, and efficiency ratios for Shenzhen Huaqiang Industry Co., Ltd. (000062SZ).
- Interactive Dashboard and Charts: Visual representations that summarize essential valuation metrics for straightforward analysis.
How It Operates
- Step 1: Download the Excel file.
- Step 2: Examine the pre-filled data for Shenzhen Huaqiang Industry Co., Ltd. (000062SZ) (historical and projected).
- Step 3: Modify key assumptions (highlighted in yellow) based on your assessment.
- Step 4: Observe the automatic updates reflecting the intrinsic value of Shenzhen Huaqiang Industry Co., Ltd. (000062SZ).
- Step 5: Utilize the results for investment analysis or reporting purposes.
Why Opt for This Calculator?
- Precise Information: Accurate financial data from Shenzhen Huaqiang Industry Co., Ltd. ensures dependable valuation outcomes.
- Flexible: Tailor critical factors such as growth rates, WACC, and tax rates to align with your forecasts.
- Efficient: Pre-configured calculations allow you to bypass the hassle of starting from the ground up.
- Expert-Level Tool: Crafted for investors, analysts, and consultants alike.
- Easy to Use: An intuitive design and clear, step-by-step guidance make it accessible for everyone.
Who Can Benefit from This Product?
- Investors: Evaluate Shenzhen Huaqiang Industry Co., Ltd.'s (000062SZ) market value before making investment decisions.
- CFOs and Financial Analysts: Optimize valuation workflows and validate financial forecasts.
- Startup Founders: Gain insights into the valuation methods used for established firms like Shenzhen Huaqiang Industry Co., Ltd.
- Consultants: Create detailed valuation reports to support client needs.
- Students and Educators: Utilize real market data to practice and teach valuation concepts.
Contents of the Template
- Preloaded HUAQIANG Data: Historical and forecasted financial metrics, including revenue, EBIT, and capital expenditures.
- DCF and WACC Models: Advanced spreadsheets for calculating intrinsic value and Weighted Average Cost of Capital.
- Editable Inputs: Cells highlighted in yellow for adjusting revenue growth rates, tax rates, and discount rates.
- Financial Statements: Detailed annual and quarterly financial reports for in-depth analysis.
- Key Ratios: Metrics on profitability, leverage, and efficiency to assess performance.
- Dashboard and Charts: Visual representations of valuation results and underlying assumptions.
Disclaimer
All information, articles, and product details provided on this website are for general informational and educational purposes only. We do not claim any ownership over, nor do we intend to infringe upon, any trademarks, copyrights, logos, brand names, or other intellectual property mentioned or depicted on this site. Such intellectual property remains the property of its respective owners, and any references here are made solely for identification or informational purposes, without implying any affiliation, endorsement, or partnership.
We make no representations or warranties, express or implied, regarding the accuracy, completeness, or suitability of any content or products presented. Nothing on this website should be construed as legal, tax, investment, financial, medical, or other professional advice. In addition, no part of this site—including articles or product references—constitutes a solicitation, recommendation, endorsement, advertisement, or offer to buy or sell any securities, franchises, or other financial instruments, particularly in jurisdictions where such activity would be unlawful.
All content is of a general nature and may not address the specific circumstances of any individual or entity. It is not a substitute for professional advice or services. Any actions you take based on the information provided here are strictly at your own risk. You accept full responsibility for any decisions or outcomes arising from your use of this website and agree to release us from any liability in connection with your use of, or reliance upon, the content or products found herein.