
|
Financial Street Holdings Co., Ltd. (000402.sz) Avaliação DCF |
Totalmente Editável: Adapte-Se Às Suas Necessidades No Excel Ou Planilhas
Design Profissional: Modelos Confiáveis E Padrão Da Indústria
Pré-Construídos Para Uso Rápido E Eficiente
Compatível com MAC/PC, totalmente desbloqueado
Não É Necessária Experiência; Fácil De Seguir
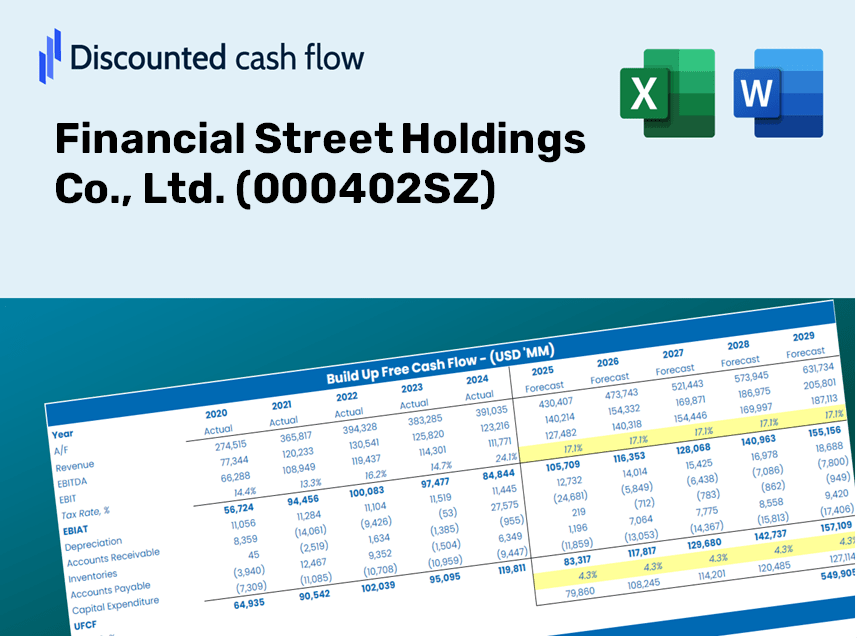
Financial Street Holdings Co., Ltd. (000402.SZ) Bundle
Procurando determinar o valor intrínseco da Financial Street Holdings Co., Ltd.? Nossa calculadora DCF (000402SZ) integra dados do mundo real com recursos abrangentes de personalização, permitindo ajustar as previsões e aprimorar suas estratégias de investimento.
Discounted Cash Flow (DCF) - (USD MM)
| Year | AY1 2020 |
AY2 2021 |
AY3 2022 |
AY4 2023 |
AY5 2024 |
FY1 2025 |
FY2 2026 |
FY3 2027 |
FY4 2028 |
FY5 2029 |
|---|---|---|---|---|---|---|---|---|---|---|
| Revenue | 18,121.4 | 24,155.3 | 20,505.8 | 12,570.6 | 19,074.9 | 20,564.3 | 22,170.0 | 23,901.1 | 25,767.4 | 27,779.4 |
| Revenue Growth, % | 0 | 33.3 | -15.11 | -38.7 | 51.74 | 7.81 | 7.81 | 7.81 | 7.81 | 7.81 |
| EBITDA | 2,629.5 | 2,231.6 | 1,142.3 | -870.3 | -5,841.7 | -338.5 | -364.9 | -393.4 | -424.1 | -457.2 |
| EBITDA, % | 14.51 | 9.24 | 5.57 | -6.92 | -30.63 | -1.65 | -1.65 | -1.65 | -1.65 | -1.65 |
| Depreciation | 133.5 | 136.9 | 122.0 | 116.0 | 117.3 | 141.3 | 152.4 | 164.3 | 177.1 | 190.9 |
| Depreciation, % | 0.73685 | 0.56664 | 0.59483 | 0.92309 | 0.6152 | 0.68732 | 0.68732 | 0.68732 | 0.68732 | 0.68732 |
| EBIT | 2,496.0 | 2,094.7 | 1,020.3 | -986.4 | -5,959.1 | -479.8 | -517.3 | -557.6 | -601.2 | -648.1 |
| EBIT, % | 13.77 | 8.67 | 4.98 | -7.85 | -31.24 | -2.33 | -2.33 | -2.33 | -2.33 | -2.33 |
| Total Cash | 18,817.1 | 17,854.0 | 16,875.5 | 13,798.8 | 12,811.0 | 17,412.7 | 18,772.3 | 20,238.1 | 21,818.4 | 23,522.0 |
| Total Cash, percent | .0 | .0 | .0 | .0 | .0 | .0 | .0 | .0 | .0 | .0 |
| Account Receivables | 1.6 | 721.8 | 8,585.8 | 7,353.1 | 5,214.4 | 5,375.4 | 5,795.2 | 6,247.7 | 6,735.5 | 7,261.4 |
| Account Receivables, % | 0.00881247 | 2.99 | 41.87 | 58.49 | 27.34 | 26.14 | 26.14 | 26.14 | 26.14 | 26.14 |
| Inventories | 82,005.7 | 84,252.2 | 74,295.5 | 69,200.6 | 50,989.5 | 20,564.3 | 22,170.0 | 23,901.1 | 25,767.4 | 27,779.4 |
| Inventories, % | 452.54 | 348.79 | 362.31 | 550.49 | 267.31 | 100 | 100 | 100 | 100 | 100 |
| Accounts Payable | 7,689.9 | 9,601.7 | 8,692.7 | 6,825.1 | 5,878.2 | 8,624.2 | 9,297.6 | 10,023.5 | 10,806.2 | 11,650.0 |
| Accounts Payable, % | 42.44 | 39.75 | 42.39 | 54.29 | 30.82 | 41.94 | 41.94 | 41.94 | 41.94 | 41.94 |
| Capital Expenditure | -52.6 | -64.0 | -105.2 | -56.6 | -27.4 | -68.4 | -73.7 | -79.5 | -85.7 | -92.4 |
| Capital Expenditure, % | -0.29027 | -0.265 | -0.51312 | -0.45056 | -0.14347 | -0.33249 | -0.33249 | -0.33249 | -0.33249 | -0.33249 |
| Tax Rate, % | 0.00405082 | 0.00405082 | 0.00405082 | 0.00405082 | 0.00405082 | 0.00405082 | 0.00405082 | 0.00405082 | 0.00405082 | 0.00405082 |
| EBITAT | 1,802.0 | 1,275.2 | 794.4 | -744.6 | -5,958.8 | -370.8 | -399.8 | -431.0 | -464.6 | -500.9 |
| Depreciation | ||||||||||
| Changes in Account Receivables | ||||||||||
| Changes in Inventories | ||||||||||
| Changes in Accounts Payable | ||||||||||
| Capital Expenditure | ||||||||||
| UFCF | -72,434.4 | 293.2 | 1,994.9 | 3,774.8 | 13,534.1 | 32,712.2 | -1,673.1 | -1,803.8 | -1,944.6 | -2,096.5 |
| WACC, % | 3.25 | 2.9 | 3.43 | 3.36 | 4.13 | 3.41 | 3.41 | 3.41 | 3.41 | 3.41 |
| PV UFCF | ||||||||||
| SUM PV UFCF | 24,963.9 | |||||||||
| Long Term Growth Rate, % | 2.00 | |||||||||
| Free cash flow (T + 1) | -2,138 | |||||||||
| Terminal Value | -151,144 | |||||||||
| Present Terminal Value | -127,784 | |||||||||
| Enterprise Value | -102,820 | |||||||||
| Net Debt | 53,283 | |||||||||
| Equity Value | -156,103 | |||||||||
| Diluted Shares Outstanding, MM | 2,988 | |||||||||
| Equity Value Per Share | -52.25 |
Benefits You Will Enjoy
- Ready-to-Use Financial Model: Financial Street Holdings Co., Ltd.'s actual data provides an accurate DCF valuation.
- Comprehensive Forecast Management: Modify revenue growth, profit margins, WACC, and other significant factors at your convenience.
- Real-Time Calculations: Automatic updates guarantee that you receive immediate feedback as adjustments are made.
- Professional-Quality Template: An expertly crafted Excel file designed for high-standard valuation processes.
- Flexible and Reusable: Customized for adaptability, facilitating repeated use for in-depth forecasting.
Key Features
- 🔍 Real-Life Financials for Financial Street Holdings: Access comprehensive historical and projected data for Financial Street Holdings Co., Ltd. (000402SZ).
- ✏️ Fully Customizable Inputs: Modify all essential parameters (highlighted in yellow), such as WACC, growth %, and tax rates.
- 📊 Professional DCF Valuation: Utilize integrated formulas to determine the intrinsic value of Financial Street Holdings using the Discounted Cash Flow method.
- ⚡ Instant Results: Quickly visualize the valuation of Financial Street Holdings after any adjustments.
- Scenario Analysis: Evaluate and contrast outcomes for different financial scenarios side-by-side.
How It Works
- Step 1: Download the prebuilt Excel template featuring Financial Street Holdings Co., Ltd.'s (000402SZ) data.
- Step 2: Explore the pre-filled sheets to familiarize yourself with the key financial metrics.
- Step 3: Update forecasts and assumptions in the editable yellow cells (WACC, growth, margins).
- Step 4: Instantly see recalculated results, including the intrinsic value of Financial Street Holdings Co., Ltd. (000402SZ).
- Step 5: Use the outputs to make informed investment decisions or create detailed reports.
Why Choose the Financial Street Holdings Co., Ltd. (000402SZ) Calculator?
- Save Time: Instantly access a pre-built DCF model – no need to start from the ground up.
- Enhance Accuracy: Utilize dependable financial data and formulas to minimize valuation errors.
- Completely Customizable: Adjust the model to suit your unique assumptions and forecasts.
- User-Friendly: Intuitive charts and outputs facilitate straightforward analysis of results.
- Endorsed by Professionals: Crafted for experts who prioritize accuracy and ease of use.
Who Can Benefit from This Product?
- Institutional Investors: Develop comprehensive and trustworthy valuation models for portfolio assessment.
- Corporate Finance Departments: Evaluate valuation scenarios to inform strategic decisions.
- Financial Consultants and Advisors: Deliver precise valuation insights for Financial Street Holdings Co., Ltd. (000402SZ).
- Students and Instructors: Utilize real-world financial data for hands-on learning and teaching of financial modeling.
- Market Analysts: Gain insights into the valuation processes of companies like Financial Street Holdings Co., Ltd. (000402SZ).
What the Template Contains
- Historical Data: Includes Financial Street Holdings Co., Ltd.'s (000402SZ) past financial performance and baseline forecasts.
- DCF and Levered DCF Models: Comprehensive templates for calculating the intrinsic value of Financial Street Holdings Co., Ltd. (000402SZ).
- WACC Sheet: Pre-configured calculations for the Weighted Average Cost of Capital.
- Editable Inputs: Adjust key drivers such as growth rates, EBITDA %, and CAPEX assumptions.
- Quarterly and Annual Statements: A thorough analysis of Financial Street Holdings Co., Ltd.'s (000402SZ) financials.
- Interactive Dashboard: Visualize valuation results and forecasts in a dynamic manner.
Disclaimer
All information, articles, and product details provided on this website are for general informational and educational purposes only. We do not claim any ownership over, nor do we intend to infringe upon, any trademarks, copyrights, logos, brand names, or other intellectual property mentioned or depicted on this site. Such intellectual property remains the property of its respective owners, and any references here are made solely for identification or informational purposes, without implying any affiliation, endorsement, or partnership.
We make no representations or warranties, express or implied, regarding the accuracy, completeness, or suitability of any content or products presented. Nothing on this website should be construed as legal, tax, investment, financial, medical, or other professional advice. In addition, no part of this site—including articles or product references—constitutes a solicitation, recommendation, endorsement, advertisement, or offer to buy or sell any securities, franchises, or other financial instruments, particularly in jurisdictions where such activity would be unlawful.
All content is of a general nature and may not address the specific circumstances of any individual or entity. It is not a substitute for professional advice or services. Any actions you take based on the information provided here are strictly at your own risk. You accept full responsibility for any decisions or outcomes arising from your use of this website and agree to release us from any liability in connection with your use of, or reliance upon, the content or products found herein.