
|
Wushang Group Co., Ltd. (000501.sz) Avaliação DCF |
Totalmente Editável: Adapte-Se Às Suas Necessidades No Excel Ou Planilhas
Design Profissional: Modelos Confiáveis E Padrão Da Indústria
Pré-Construídos Para Uso Rápido E Eficiente
Compatível com MAC/PC, totalmente desbloqueado
Não É Necessária Experiência; Fácil De Seguir
Wushang Group Co., Ltd. (000501.SZ) Bundle
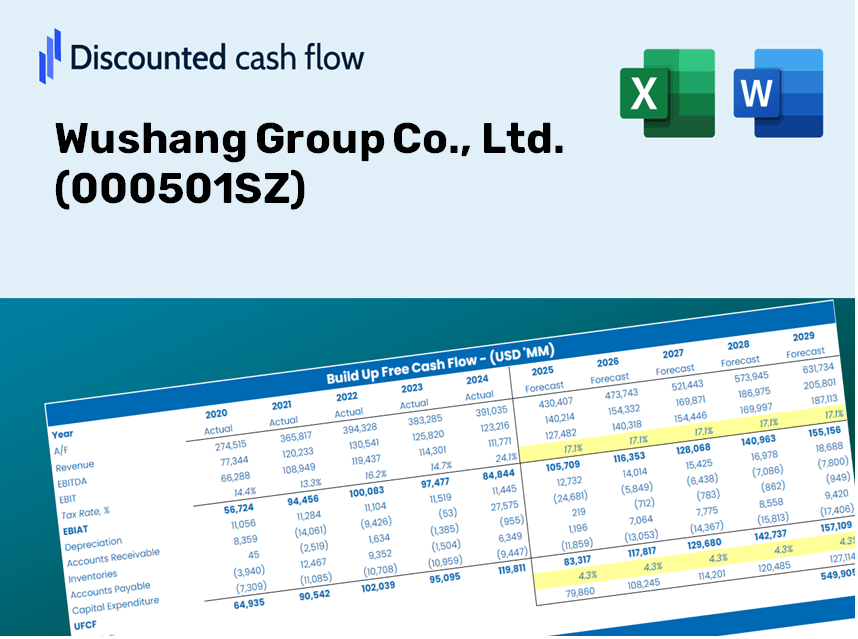
Aprimore sua estratégia de investimento com a calculadora DCF do Wushang Group Co., Ltd. (000501SZ)! Explore os autênticos dados financeiros de Wushang, ajuste as projeções e despesas de crescimento e observe como essas mudanças afetam o valor intrínseco do grupo Wushang em tempo real.
Discounted Cash Flow (DCF) - (USD MM)
| Year | AY1 2020 |
AY2 2021 |
AY3 2022 |
AY4 2023 |
AY5 2024 |
FY1 2025 |
FY2 2026 |
FY3 2027 |
FY4 2028 |
FY5 2029 |
|---|---|---|---|---|---|---|---|---|---|---|
| Revenue | 7,639.4 | 7,126.5 | 6,337.2 | 7,177.5 | 6,703.7 | 6,517.2 | 6,335.8 | 6,159.5 | 5,988.1 | 5,821.5 |
| Revenue Growth, % | 0 | -6.71 | -11.08 | 13.26 | -6.6 | -2.78 | -2.78 | -2.78 | -2.78 | -2.78 |
| EBITDA | 1,000.9 | 1,346.5 | 855.5 | 1,160.6 | 1,174.8 | 1,032.2 | 1,003.4 | 975.5 | 948.4 | 922.0 |
| EBITDA, % | 13.1 | 18.89 | 13.5 | 16.17 | 17.52 | 15.84 | 15.84 | 15.84 | 15.84 | 15.84 |
| Depreciation | 294.9 | 292.4 | 315.9 | 651.1 | 662.9 | 415.9 | 404.3 | 393.1 | 382.1 | 371.5 |
| Depreciation, % | 3.86 | 4.1 | 4.99 | 9.07 | 9.89 | 6.38 | 6.38 | 6.38 | 6.38 | 6.38 |
| EBIT | 706.0 | 1,054.0 | 539.5 | 509.5 | 511.9 | 616.3 | 599.1 | 582.4 | 566.2 | 550.5 |
| EBIT, % | 9.24 | 14.79 | 8.51 | 7.1 | 7.64 | 9.46 | 9.46 | 9.46 | 9.46 | 9.46 |
| Total Cash | 1,894.1 | 2,157.9 | 2,292.5 | 3,073.3 | 2,690.6 | 2,270.6 | 2,207.4 | 2,146.0 | 2,086.3 | 2,028.2 |
| Total Cash, percent | .0 | .0 | .0 | .0 | .0 | .0 | .0 | .0 | .0 | .0 |
| Account Receivables | 170.6 | 189.7 | 270.7 | .0 | 285.3 | 175.0 | 170.1 | 165.4 | 160.7 | 156.3 |
| Account Receivables, % | 2.23 | 2.66 | 4.27 | 0 | 4.26 | 2.68 | 2.68 | 2.68 | 2.68 | 2.68 |
| Inventories | 2,272.8 | 1,902.1 | 1,910.9 | 1,738.5 | 1,486.2 | 1,733.4 | 1,685.2 | 1,638.3 | 1,592.7 | 1,548.4 |
| Inventories, % | 29.75 | 26.69 | 30.15 | 24.22 | 22.17 | 26.6 | 26.6 | 26.6 | 26.6 | 26.6 |
| Accounts Payable | 2,503.6 | 2,255.7 | 1,701.2 | 2,256.2 | 2,122.0 | 2,011.9 | 1,956.0 | 1,901.5 | 1,848.6 | 1,797.2 |
| Accounts Payable, % | 32.77 | 31.65 | 26.85 | 31.43 | 31.65 | 30.87 | 30.87 | 30.87 | 30.87 | 30.87 |
| Capital Expenditure | -1,246.4 | -3,794.3 | -2,470.4 | -1,426.1 | -487.4 | -1,768.5 | -1,719.3 | -1,671.5 | -1,624.9 | -1,579.7 |
| Capital Expenditure, % | -16.32 | -53.24 | -38.98 | -19.87 | -7.27 | -27.14 | -27.14 | -27.14 | -27.14 | -27.14 |
| Tax Rate, % | 35.36 | 35.36 | 35.36 | 35.36 | 35.36 | 35.36 | 35.36 | 35.36 | 35.36 | 35.36 |
| EBITAT | 532.9 | 791.0 | 369.6 | 302.4 | 330.9 | 422.8 | 411.0 | 399.6 | 388.5 | 377.6 |
| Depreciation | ||||||||||
| Changes in Account Receivables | ||||||||||
| Changes in Inventories | ||||||||||
| Changes in Accounts Payable | ||||||||||
| Capital Expenditure | ||||||||||
| UFCF | -358.4 | -2,607.2 | -2,429.2 | 525.6 | 339.1 | -1,176.7 | -906.8 | -881.6 | -857.1 | -833.2 |
| WACC, % | 3.91 | 3.9 | 3.75 | 3.55 | 3.67 | 3.76 | 3.76 | 3.76 | 3.76 | 3.76 |
| PV UFCF | ||||||||||
| SUM PV UFCF | -4,198.1 | |||||||||
| Long Term Growth Rate, % | 2.00 | |||||||||
| Free cash flow (T + 1) | -850 | |||||||||
| Terminal Value | -48,366 | |||||||||
| Present Terminal Value | -40,221 | |||||||||
| Enterprise Value | -44,419 | |||||||||
| Net Debt | 5,075 | |||||||||
| Equity Value | -49,495 | |||||||||
| Diluted Shares Outstanding, MM | 750 | |||||||||
| Equity Value Per Share | -66.00 |
Benefits You Will Receive
- Customizable Excel Template: A fully adjustable Excel-based DCF Calculator featuring pre-filled financial data for Wushang Group Co., Ltd. (000501SZ).
- Authentic Data: Access to historical performance data and forward-looking projections (indicated in the highlighted cells).
- Flexible Forecasting: Modify forecast parameters such as revenue growth, EBITDA margin, and WACC as needed.
- Instant Calculations: Quickly observe how your inputs influence Wushang Group's valuation.
- Professional Resource: Designed for investors, CFOs, consultants, and financial analysts.
- Intuitive Design: Organized for simplicity and effectiveness, complete with step-by-step guidance.
Core Advantages
- Customizable Forecast Inputs: Adjust essential elements such as revenue growth rates, EBITDA percentages, and capital expenditures.
- Instant DCF Valuation: Automatically computes intrinsic value, NPV, and related metrics in real-time.
- High-Precision Accuracy: Leverages Wushang Group Co., Ltd.'s actual financial data for credible valuation results.
- Effortless Scenario Analysis: Easily evaluate various assumptions and juxtapose outcomes.
- Efficiency Booster: Streamline your process by avoiding the creation of intricate valuation models from the ground up.
How It Functions
- Step 1: Download the Excel spreadsheet.
- Step 2: Examine the pre-filled Wushang Group data (historical and forecasted).
- Step 3: Modify key assumptions (highlighted in yellow) based on your insights.
- Step 4: Observe automatic updates on Wushang Group’s intrinsic value.
- Step 5: Utilize the results for investment decisions or reporting purposes.
Why Opt for Wushang Group's Calculator?
- Precision: Accurate financial data from Wushang Group guarantees reliability.
- Versatility: Tailored for users to freely experiment and adjust their inputs.
- Efficiency: Avoid the complexity of creating a DCF model from the ground up.
- Expert-Level: Crafted with the expertise and usability of a CFO in mind.
- Intuitive: Simple to navigate, suitable for users with varying levels of financial modeling knowledge.
Who Can Benefit from This Product?
- Investors: Accurately assess the fair value of Wushang Group Co., Ltd. (000501SZ) prior to making investment choices.
- CFOs: Utilize a robust DCF model for comprehensive financial reporting and analysis.
- Consultants: Effortlessly modify the template for client valuation reports.
- Entrepreneurs: Understand financial modeling practices employed by leading companies.
- Educators: Implement it as an educational resource to illustrate valuation techniques.
Contents of the Template
- Pre-Filled DCF Model: Wushang Group’s financial data preloaded for immediate analysis.
- WACC Calculator: Comprehensive calculations for the Weighted Average Cost of Capital.
- Financial Ratios: Assess Wushang Group’s profitability, leverage, and operational efficiency.
- Editable Inputs: Modify assumptions such as growth rates, profit margins, and capital expenditure to suit your needs.
- Financial Statements: Access to annual and quarterly reports for in-depth evaluation.
- Interactive Dashboard: Visually represent key valuation metrics and outcomes with ease.
Disclaimer
All information, articles, and product details provided on this website are for general informational and educational purposes only. We do not claim any ownership over, nor do we intend to infringe upon, any trademarks, copyrights, logos, brand names, or other intellectual property mentioned or depicted on this site. Such intellectual property remains the property of its respective owners, and any references here are made solely for identification or informational purposes, without implying any affiliation, endorsement, or partnership.
We make no representations or warranties, express or implied, regarding the accuracy, completeness, or suitability of any content or products presented. Nothing on this website should be construed as legal, tax, investment, financial, medical, or other professional advice. In addition, no part of this site—including articles or product references—constitutes a solicitation, recommendation, endorsement, advertisement, or offer to buy or sell any securities, franchises, or other financial instruments, particularly in jurisdictions where such activity would be unlawful.
All content is of a general nature and may not address the specific circumstances of any individual or entity. It is not a substitute for professional advice or services. Any actions you take based on the information provided here are strictly at your own risk. You accept full responsibility for any decisions or outcomes arising from your use of this website and agree to release us from any liability in connection with your use of, or reliance upon, the content or products found herein.