
|
China Reform Health Management and Services Group Co., Ltd. (000503.sz) Avaliação DCF |
Totalmente Editável: Adapte-Se Às Suas Necessidades No Excel Ou Planilhas
Design Profissional: Modelos Confiáveis E Padrão Da Indústria
Pré-Construídos Para Uso Rápido E Eficiente
Compatível com MAC/PC, totalmente desbloqueado
Não É Necessária Experiência; Fácil De Seguir
China Reform Health Management and Services Group Co., Ltd. (000503.SZ) Bundle
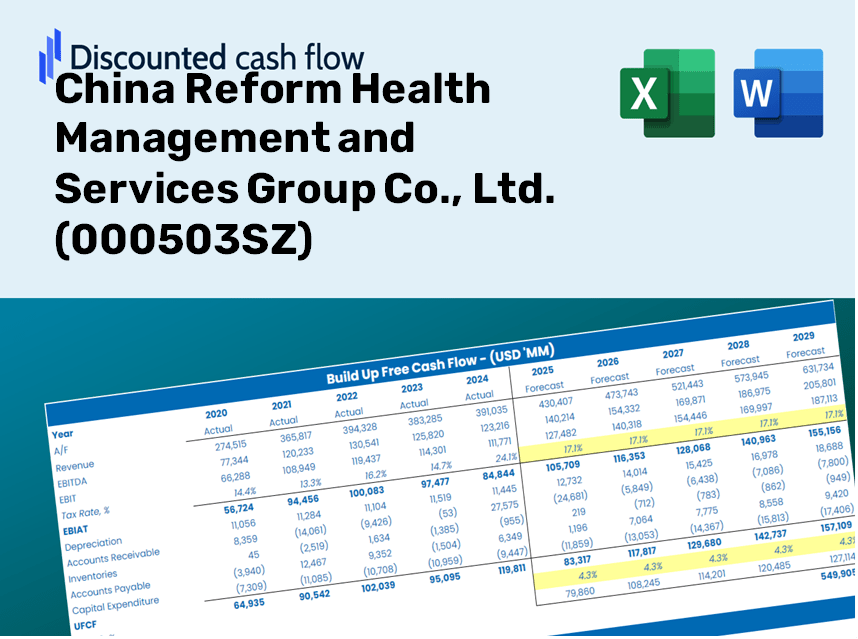
Projetado para precisão, a nossa calculadora DCF (000503SZ) permite avaliar a avaliação da China Reform Saúde Grupo de Gestão e Serviços Co., Ltd. usando dados financeiros do mundo real, fornecendo flexibilidade completa para modificar parâmetros críticos para projeções aprimoradas.
Discounted Cash Flow (DCF) - (USD MM)
| Year | AY1 2020 |
AY2 2021 |
AY3 2022 |
AY4 2023 |
AY5 2024 |
FY1 2025 |
FY2 2026 |
FY3 2027 |
FY4 2028 |
FY5 2029 |
|---|---|---|---|---|---|---|---|---|---|---|
| Revenue | 207.4 | 252.5 | 311.1 | 330.1 | 356.9 | 409.7 | 470.3 | 539.9 | 619.8 | 711.6 |
| Revenue Growth, % | 0 | 21.77 | 23.19 | 6.12 | 8.11 | 14.8 | 14.8 | 14.8 | 14.8 | 14.8 |
| EBITDA | -97.1 | -143.2 | -82.2 | -89.4 | -135.4 | -159.8 | -183.4 | -210.6 | -241.7 | -277.5 |
| EBITDA, % | -46.82 | -56.72 | -26.43 | -27.07 | -37.95 | -39 | -39 | -39 | -39 | -39 |
| Depreciation | 32.3 | 3.5 | 27.7 | 29.2 | 26.8 | 34.6 | 39.7 | 45.6 | 52.4 | 60.1 |
| Depreciation, % | 15.58 | 1.4 | 8.92 | 8.84 | 7.51 | 8.45 | 8.45 | 8.45 | 8.45 | 8.45 |
| EBIT | -129.4 | -146.8 | -110.0 | -118.5 | -162.2 | -194.4 | -223.2 | -256.2 | -294.1 | -337.6 |
| EBIT, % | -62.39 | -58.12 | -35.34 | -35.91 | -45.45 | -47.44 | -47.44 | -47.44 | -47.44 | -47.44 |
| Total Cash | 938.8 | 756.7 | 589.4 | 1,379.2 | 1,312.8 | 409.7 | 470.3 | 539.9 | 619.8 | 711.6 |
| Total Cash, percent | .0 | .0 | .0 | .0 | .0 | .0 | .0 | .0 | .0 | .0 |
| Account Receivables | 75.2 | 109.8 | 170.9 | 206.7 | 232.2 | 215.0 | 246.8 | 283.3 | 325.2 | 373.4 |
| Account Receivables, % | 36.25 | 43.48 | 54.95 | 62.63 | 65.05 | 52.47 | 52.47 | 52.47 | 52.47 | 52.47 |
| Inventories | .0 | .0 | -419.9 | 2.0 | .7 | -81.3 | -93.3 | -107.1 | -122.9 | -141.1 |
| Inventories, % | 0.00504648 | 0.00200107 | -135 | 0.61748 | 0.20704 | -19.83 | -19.83 | -19.83 | -19.83 | -19.83 |
| Accounts Payable | 2.3 | 4.3 | 8.3 | 25.7 | 50.3 | 22.4 | 25.8 | 29.6 | 33.9 | 39.0 |
| Accounts Payable, % | 1.1 | 1.71 | 2.68 | 7.79 | 14.1 | 5.47 | 5.47 | 5.47 | 5.47 | 5.47 |
| Capital Expenditure | -17.7 | -23.1 | -37.7 | -52.1 | -37.6 | -46.0 | -52.8 | -60.6 | -69.6 | -79.9 |
| Capital Expenditure, % | -8.54 | -9.16 | -12.11 | -15.77 | -10.54 | -11.22 | -11.22 | -11.22 | -11.22 | -11.22 |
| Tax Rate, % | 11.26 | 11.26 | 11.26 | 11.26 | 11.26 | 11.26 | 11.26 | 11.26 | 11.26 | 11.26 |
| EBITAT | -129.3 | -145.9 | -111.5 | -120.6 | -144.0 | -189.7 | -217.8 | -250.0 | -287.0 | -329.5 |
| Depreciation | ||||||||||
| Changes in Account Receivables | ||||||||||
| Changes in Inventories | ||||||||||
| Changes in Accounts Payable | ||||||||||
| Capital Expenditure | ||||||||||
| UFCF | -187.6 | -198.0 | 241.4 | -583.9 | -154.3 | -129.8 | -247.3 | -283.9 | -325.9 | -374.2 |
| WACC, % | 6.31 | 6.3 | 6.31 | 6.31 | 6.29 | 6.3 | 6.3 | 6.3 | 6.3 | 6.3 |
| PV UFCF | ||||||||||
| SUM PV UFCF | -1,108.3 | |||||||||
| Long Term Growth Rate, % | 2.00 | |||||||||
| Free cash flow (T + 1) | -382 | |||||||||
| Terminal Value | -8,869 | |||||||||
| Present Terminal Value | -6,534 | |||||||||
| Enterprise Value | -7,642 | |||||||||
| Net Debt | -190 | |||||||||
| Equity Value | -7,452 | |||||||||
| Diluted Shares Outstanding, MM | 979 | |||||||||
| Equity Value Per Share | -7.61 |
What You Will Receive
- Adjustable Forecast Parameters: Seamlessly modify assumptions (growth %, margins, WACC) to explore various scenarios.
- Comprehensive Data: Access to pre-filled financial information for China Reform Health Management and Services Group Co., Ltd. (000503SZ) to kickstart your analysis.
- Automated DCF Results: The template computes Net Present Value (NPV) and intrinsic value automatically for your convenience.
- Tailored and Professional Design: A sleek Excel model that can be customized to fit your valuation requirements.
- Designed for Analysts and Investors: Perfect for evaluating forecasts, validating strategies, and optimizing your time.
Key Features
- Authentic Financial Data: Gain access to precise historical figures and future forecasts tailored for China Reform Health Management and Services Group Co., Ltd. (000503SZ).
- Tailorable Projection Assumptions: Modify highlighted cells, including WACC, growth rates, and profit margins, to fit your analysis.
- Real-Time Calculations: Instantly refresh DCF, Net Present Value (NPV), and cash flow assessments as inputs change.
- Interactive Visual Dashboard: User-friendly charts and summaries for an intuitive view of your valuation outcomes.
- Designed for All Skill Levels: A straightforward and accessible layout suitable for investors, CFOs, and consultants alike.
How It Functions
- 1. Access the Template: Download and open the Excel file featuring data preloaded for China Reform Health Management and Services Group Co., Ltd. (000503SZ).
- 2. Modify Assumptions: Adjust essential inputs such as growth rates, WACC, and capital expenditures.
- 3. View Results in Real-Time: The DCF model automatically computes intrinsic value and NPV.
- 4. Explore Scenarios: Evaluate multiple forecasts to assess various valuation outcomes.
- 5. Present with Assurance: Share expert valuation insights to bolster your decision-making.
Why Select This Calculator for China Reform Health Management and Services Group Co., Ltd. (000503SZ)?
- Precision: Utilizes accurate financial data to ensure reliable results.
- Adaptability: Built to allow users to easily adjust and test various inputs.
- Efficiency: Avoid the complexities of creating a discounted cash flow model from the ground up.
- Professional Quality: Crafted with the expertise and precision expected at the CFO level.
- User Accessibility: Intuitive design makes it suitable for users without extensive financial modeling knowledge.
Who Can Benefit from Our Services?
- Healthcare Investors: Make informed decisions with our comprehensive market analysis tools.
- Data Analysts: Utilize our pre-built models to streamline your health service assessments.
- Consultants: Easily modify our templates for tailored client presentations or reports.
- Health Professionals: Enhance your knowledge of health management strategies through practical examples.
- Educators and Students: Leverage our resources as a hands-on learning tool in health management courses.
Components of the Template
- Historical Performance Data: Features past financial records and foundational forecasts for China Reform Health Management and Services Group Co., Ltd. (000503SZ).
- DCF and Levered DCF Models: Comprehensive templates for assessing the intrinsic value of China Reform Health Management and Services Group Co., Ltd. (000503SZ).
- WACC Calculation Sheet: Ready-made calculations for the Weighted Average Cost of Capital.
- Customizable Inputs: Adjust essential factors such as growth rates, EBITDA percentages, and CAPEX assumptions.
- Quarterly and Annual Financial Statements: An in-depth analysis of China Reform Health Management and Services Group Co., Ltd. (000503SZ) financials.
- Dynamic Dashboard: Visualize valuation outcomes and projections interactively.
Disclaimer
All information, articles, and product details provided on this website are for general informational and educational purposes only. We do not claim any ownership over, nor do we intend to infringe upon, any trademarks, copyrights, logos, brand names, or other intellectual property mentioned or depicted on this site. Such intellectual property remains the property of its respective owners, and any references here are made solely for identification or informational purposes, without implying any affiliation, endorsement, or partnership.
We make no representations or warranties, express or implied, regarding the accuracy, completeness, or suitability of any content or products presented. Nothing on this website should be construed as legal, tax, investment, financial, medical, or other professional advice. In addition, no part of this site—including articles or product references—constitutes a solicitation, recommendation, endorsement, advertisement, or offer to buy or sell any securities, franchises, or other financial instruments, particularly in jurisdictions where such activity would be unlawful.
All content is of a general nature and may not address the specific circumstances of any individual or entity. It is not a substitute for professional advice or services. Any actions you take based on the information provided here are strictly at your own risk. You accept full responsibility for any decisions or outcomes arising from your use of this website and agree to release us from any liability in connection with your use of, or reliance upon, the content or products found herein.