
|
Rongugan Property Co., Ltd. (000517.sz) Avaliação do DCF |
Totalmente Editável: Adapte-Se Às Suas Necessidades No Excel Ou Planilhas
Design Profissional: Modelos Confiáveis E Padrão Da Indústria
Pré-Construídos Para Uso Rápido E Eficiente
Compatível com MAC/PC, totalmente desbloqueado
Não É Necessária Experiência; Fácil De Seguir
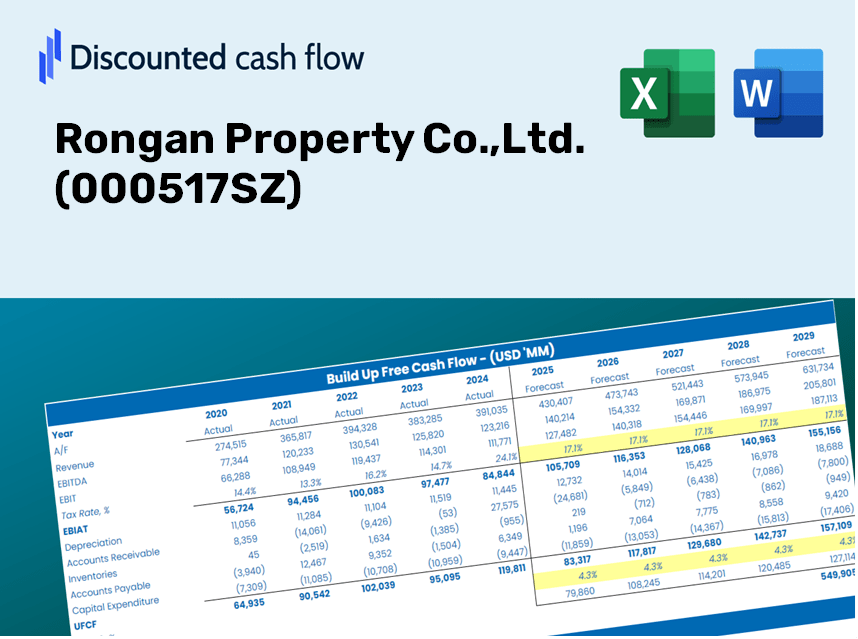
Rongan Property Co.,Ltd. (000517.SZ) Bundle
Aprimore suas estratégias de investimento com a calculadora DCF (000517SZ) da Rongugan Property Co., Ltd.! Utilize dados financeiros de propriedade genuína de Rongugan, ajuste as projeções e despesas de crescimento e observe instantaneamente como essas mudanças afetam o valor intrínseco da propriedade Rongan.
Discounted Cash Flow (DCF) - (USD MM)
| Year | AY1 2020 |
AY2 2021 |
AY3 2022 |
AY4 2023 |
AY5 2024 |
FY1 2025 |
FY2 2026 |
FY3 2027 |
FY4 2028 |
FY5 2029 |
|---|---|---|---|---|---|---|---|---|---|---|
| Revenue | 11,177.7 | 18,181.4 | 14,157.2 | 22,333.4 | 23,980.9 | 30,315.1 | 38,322.3 | 48,444.5 | 61,240.4 | 77,416.0 |
| Revenue Growth, % | 0 | 62.66 | -22.13 | 57.75 | 7.38 | 26.41 | 26.41 | 26.41 | 26.41 | 26.41 |
| EBITDA | 2,375.6 | 1,747.1 | 1,462.6 | 1,111.4 | -1,320.8 | 2,465.3 | 3,116.5 | 3,939.6 | 4,980.2 | 6,295.7 |
| EBITDA, % | 21.25 | 9.61 | 10.33 | 4.98 | -5.51 | 8.13 | 8.13 | 8.13 | 8.13 | 8.13 |
| Depreciation | 32.5 | 46.4 | 49.1 | 51.4 | 46.7 | 79.9 | 101.0 | 127.6 | 161.4 | 204.0 |
| Depreciation, % | 0.29035 | 0.2551 | 0.34695 | 0.23012 | 0.1949 | 0.26348 | 0.26348 | 0.26348 | 0.26348 | 0.26348 |
| EBIT | 2,343.1 | 1,700.7 | 1,413.4 | 1,060.0 | -1,367.6 | 2,385.4 | 3,015.5 | 3,812.0 | 4,818.9 | 6,091.7 |
| EBIT, % | 20.96 | 9.35 | 9.98 | 4.75 | -5.7 | 7.87 | 7.87 | 7.87 | 7.87 | 7.87 |
| Total Cash | 8,683.3 | 9,825.8 | 8,400.4 | 4,614.8 | 2,226.7 | 13,400.0 | 16,939.4 | 21,413.6 | 27,069.7 | 34,219.7 |
| Total Cash, percent | .0 | .0 | .0 | .0 | .0 | .0 | .0 | .0 | .0 | .0 |
| Account Receivables | 4,209.3 | 401.0 | 1,663.7 | 899.7 | 726.8 | 3,557.5 | 4,497.1 | 5,685.0 | 7,186.6 | 9,084.8 |
| Account Receivables, % | 37.66 | 2.21 | 11.75 | 4.03 | 3.03 | 11.74 | 11.74 | 11.74 | 11.74 | 11.74 |
| Inventories | 49,157.8 | 60,766.9 | 55,556.5 | 37,382.7 | 13,192.1 | 27,587.4 | 34,874.1 | 44,085.6 | 55,730.1 | 70,450.3 |
| Inventories, % | 439.78 | 334.23 | 392.43 | 167.38 | 55.01 | 91 | 91 | 91 | 91 | 91 |
| Accounts Payable | 4,520.6 | 4,063.0 | 3,704.1 | 3,084.1 | 2,407.7 | 6,839.3 | 8,645.8 | 10,929.5 | 13,816.3 | 17,465.7 |
| Accounts Payable, % | 40.44 | 22.35 | 26.16 | 13.81 | 10.04 | 22.56 | 22.56 | 22.56 | 22.56 | 22.56 |
| Capital Expenditure | -9.2 | -7.2 | -6.9 | -1.4 | -1.0 | -11.0 | -13.9 | -17.5 | -22.1 | -28.0 |
| Capital Expenditure, % | -0.08188041 | -0.03980326 | -0.04862395 | -0.00618059 | -0.00423094 | -0.03614383 | -0.03614383 | -0.03614383 | -0.03614383 | -0.03614383 |
| Tax Rate, % | -12.69 | -12.69 | -12.69 | -12.69 | -12.69 | -12.69 | -12.69 | -12.69 | -12.69 | -12.69 |
| EBITAT | 1,785.8 | 1,120.2 | 708.3 | 416.3 | -1,541.2 | 1,581.4 | 1,999.1 | 2,527.1 | 3,194.6 | 4,038.4 |
| Depreciation | ||||||||||
| Changes in Account Receivables | ||||||||||
| Changes in Inventories | ||||||||||
| Changes in Accounts Payable | ||||||||||
| Capital Expenditure | ||||||||||
| UFCF | -47,037.4 | -7,099.1 | 4,339.4 | 18,784.0 | 22,191.7 | -11,144.1 | -4,333.7 | -5,478.4 | -6,925.5 | -8,754.7 |
| WACC, % | 7.03 | 6.84 | 6.53 | 6.33 | 7.49 | 6.84 | 6.84 | 6.84 | 6.84 | 6.84 |
| PV UFCF | ||||||||||
| SUM PV UFCF | -30,320.1 | |||||||||
| Long Term Growth Rate, % | 2.00 | |||||||||
| Free cash flow (T + 1) | -8,930 | |||||||||
| Terminal Value | -184,342 | |||||||||
| Present Terminal Value | -132,395 | |||||||||
| Enterprise Value | -162,715 | |||||||||
| Net Debt | 128 | |||||||||
| Equity Value | -162,843 | |||||||||
| Diluted Shares Outstanding, MM | 3,184 | |||||||||
| Equity Value Per Share | -51.14 |
Benefits You Will Receive
- Comprehensive Financial Model: Rongan Property Co.,Ltd.'s (000517SZ) actual data facilitates accurate DCF valuation.
- Complete Forecasting Flexibility: Modify revenue growth, profit margins, discount rates, and other essential variables.
- Real-Time Calculations: Automatic updates provide immediate feedback as adjustments are made.
- Professional-Grade Template: An enhanced Excel file crafted for high-quality valuation presentations.
- Adaptable and Reusable: Engineered for versatility, allowing for ongoing use in detailed financial forecasting.
Key Features
- Real-Time Rongan Property Data: Pre-populated with Rongan’s historical financial performance and projected growth metrics.
- Customizable Parameters: Tailor inputs such as revenue growth rates, profit margins, discount rates, tax obligations, and capital investments.
- Dynamic Valuation Framework: Automatic recalculations of Net Present Value (NPV) and intrinsic valuation based on your specified parameters.
- Scenario Analysis: Generate various forecasting scenarios to evaluate diverse valuation results.
- User-Centric Interface: Intuitive and well-organized, catering to both industry professionals and newcomers.
How It Functions
- Step 1: Download the Excel file.
- Step 2: Examine the pre-filled Rongan Property Co., Ltd. data (historical and projected).
- Step 3: Modify key assumptions (yellow cells) according to your analysis.
- Step 4: Observe automatic recalculations for Rongan Property's intrinsic value.
- Step 5: Utilize the results for investment decisions or reporting.
Why Choose Rongan Property Co., Ltd. ([000517SZ])?
- Precision: Utilizes reliable financial data for unparalleled accuracy.
- Versatility: Allows users to explore and adjust inputs without limitations.
- Efficiency: Avoid the complexity of creating a financial model from the ground up.
- High-Quality Standards: Crafted with the expertise and insights of industry professionals.
- Intuitive Interface: Designed for ease of use, perfect for individuals at any financial skill level.
Who Can Benefit from Our Services?
- Real Estate Investors: Make informed choices with our comprehensive valuation tools specifically designed for properties.
- Financial Analysts: Streamline your workflow with customizable DCF models tailored for the real estate sector.
- Consultants: Effortlessly modify templates for client reports or presentations in the property market.
- Property Enthusiasts: Enhance your knowledge of real estate valuation techniques through practical examples and case studies.
- Educators and Students: Utilize our resources as effective learning aids in real estate and finance courses.
Contents of the Rongan Property Template
- Preloaded Rongan Property Data: Historical and projected financial information, covering revenue, EBIT, and capital expenditures.
- DCF and WACC Models: Professional-grade spreadsheets designed for calculating intrinsic value and Weighted Average Cost of Capital.
- Editable Inputs: Cells highlighted in yellow for adjusting revenue growth, tax rates, and discount rates.
- Financial Statements: Detailed annual and quarterly financials for in-depth analysis.
- Key Ratios: Metrics on profitability, leverage, and efficiency to assess performance.
- Dashboard and Charts: Visual representations of valuation results and underlying assumptions.
Disclaimer
All information, articles, and product details provided on this website are for general informational and educational purposes only. We do not claim any ownership over, nor do we intend to infringe upon, any trademarks, copyrights, logos, brand names, or other intellectual property mentioned or depicted on this site. Such intellectual property remains the property of its respective owners, and any references here are made solely for identification or informational purposes, without implying any affiliation, endorsement, or partnership.
We make no representations or warranties, express or implied, regarding the accuracy, completeness, or suitability of any content or products presented. Nothing on this website should be construed as legal, tax, investment, financial, medical, or other professional advice. In addition, no part of this site—including articles or product references—constitutes a solicitation, recommendation, endorsement, advertisement, or offer to buy or sell any securities, franchises, or other financial instruments, particularly in jurisdictions where such activity would be unlawful.
All content is of a general nature and may not address the specific circumstances of any individual or entity. It is not a substitute for professional advice or services. Any actions you take based on the information provided here are strictly at your own risk. You accept full responsibility for any decisions or outcomes arising from your use of this website and agree to release us from any liability in connection with your use of, or reliance upon, the content or products found herein.