
|
Tianjin Guangyu Development Co., Ltd. (000537.sz) Avaliação DCF |
Totalmente Editável: Adapte-Se Às Suas Necessidades No Excel Ou Planilhas
Design Profissional: Modelos Confiáveis E Padrão Da Indústria
Pré-Construídos Para Uso Rápido E Eficiente
Compatível com MAC/PC, totalmente desbloqueado
Não É Necessária Experiência; Fácil De Seguir
Tianjin Guangyu Development Co., Ltd. (000537.SZ) Bundle
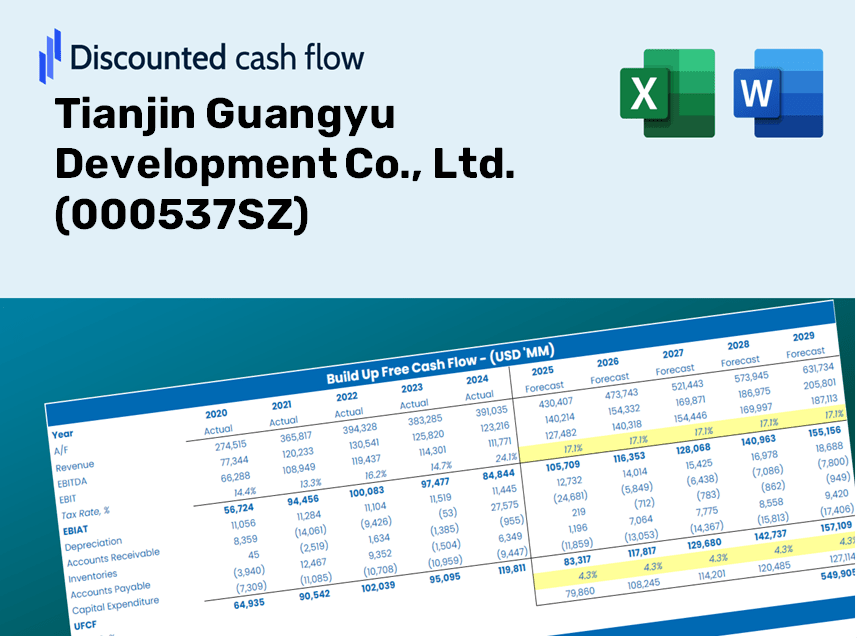
Procurando avaliar o valor intrínseco da Tianjin Guangyu Development Co., Ltd.? Nossa calculadora DCF (000537SZ) integra dados do mundo real com extensos recursos de personalização, permitindo refinar suas previsões e fazer escolhas de investimento mais informadas.
Discounted Cash Flow (DCF) - (USD MM)
| Year | AY1 2020 |
AY2 2021 |
AY3 2022 |
AY4 2023 |
AY5 2024 |
FY1 2025 |
FY2 2026 |
FY3 2027 |
FY4 2028 |
FY5 2029 |
|---|---|---|---|---|---|---|---|---|---|---|
| Revenue | 9.0 | 19,583.0 | 3,429.8 | 3,690.6 | 3,840.2 | 4,120.3 | 4,420.8 | 4,743.2 | 5,089.1 | 5,460.2 |
| Revenue Growth, % | 0 | 218341.11 | -82.49 | 7.6 | 4.05 | 7.29 | 7.29 | 7.29 | 7.29 | 7.29 |
| EBITDA | 679.1 | 3,272.1 | 2,721.2 | 2,893.6 | 3,033.4 | 2,912.6 | 3,125.0 | 3,352.9 | 3,597.4 | 3,859.8 |
| EBITDA, % | 7575.26 | 16.71 | 79.34 | 78.41 | 78.99 | 70.69 | 70.69 | 70.69 | 70.69 | 70.69 |
| Depreciation | 320.2 | 1,481.1 | 1,255.4 | 1,305.6 | 1,321.5 | 1,763.1 | 1,891.7 | 2,029.7 | 2,177.7 | 2,336.5 |
| Depreciation, % | 3571.95 | 7.56 | 36.6 | 35.38 | 34.41 | 42.79 | 42.79 | 42.79 | 42.79 | 42.79 |
| EBIT | 358.9 | 1,791.0 | 1,465.7 | 1,588.0 | 1,711.9 | 1,973.5 | 2,117.4 | 2,271.9 | 2,437.5 | 2,615.3 |
| EBIT, % | 4003.31 | 9.15 | 42.74 | 43.03 | 44.58 | 47.9 | 47.9 | 47.9 | 47.9 | 47.9 |
| Total Cash | 6,696.4 | 5,422.3 | 4,877.4 | 8,998.4 | 6,611.4 | 3,524.4 | 3,781.4 | 4,057.2 | 4,353.1 | 4,670.6 |
| Total Cash, percent | .1 | .0 | .0 | .0 | .0 | .0 | .0 | .0 | .0 | .0 |
| Account Receivables | 1,616.5 | 5,488.9 | 4,966.0 | 6,381.9 | 7,465.1 | 3,527.2 | 3,784.4 | 4,060.4 | 4,356.6 | 4,674.3 |
| Account Receivables, % | 18031.63 | 28.03 | 144.79 | 172.92 | 194.39 | 85.61 | 85.61 | 85.61 | 85.61 | 85.61 |
| Inventories | 56,742.9 | 2.6 | 2.4 | 1.6 | .0 | 825.1 | 885.3 | 949.8 | 1,019.1 | 1,093.4 |
| Inventories, % | 632946.22 | 0.01322885 | 0.07115597 | 0.04264574 | 0 | 20.03 | 20.03 | 20.03 | 20.03 | 20.03 |
| Accounts Payable | 7,478.8 | 1,712.4 | 1,437.0 | 4,871.0 | 4,674.6 | 2,889.5 | 3,100.2 | 3,326.3 | 3,568.9 | 3,829.2 |
| Accounts Payable, % | 83423.02 | 8.74 | 41.9 | 131.98 | 121.73 | 70.13 | 70.13 | 70.13 | 70.13 | 70.13 |
| Capital Expenditure | -190.0 | -303.6 | -3,108.6 | -24,946.7 | -21,046.2 | -3,231.8 | -3,467.5 | -3,720.4 | -3,991.7 | -4,282.8 |
| Capital Expenditure, % | -2119.78 | -1.55 | -90.63 | -675.96 | -548.05 | -78.44 | -78.44 | -78.44 | -78.44 | -78.44 |
| Tax Rate, % | 24.63 | 24.63 | 24.63 | 24.63 | 24.63 | 24.63 | 24.63 | 24.63 | 24.63 | 24.63 |
| EBITAT | 273.6 | -2,550.9 | 1,136.0 | 1,250.3 | 1,290.3 | 1,215.0 | 1,303.7 | 1,398.7 | 1,500.7 | 1,610.2 |
| Depreciation | ||||||||||
| Changes in Account Receivables | ||||||||||
| Changes in Inventories | ||||||||||
| Changes in Accounts Payable | ||||||||||
| Capital Expenditure | ||||||||||
| UFCF | -50,476.9 | 45,728.0 | -469.5 | -20,371.9 | -19,712.4 | 1,074.0 | -378.8 | -406.5 | -436.1 | -467.9 |
| WACC, % | 3.16 | 1.06 | 3.19 | 3.22 | 3.13 | 2.75 | 2.75 | 2.75 | 2.75 | 2.75 |
| PV UFCF | ||||||||||
| SUM PV UFCF | -488.1 | |||||||||
| Long Term Growth Rate, % | 0.50 | |||||||||
| Free cash flow (T + 1) | -470 | |||||||||
| Terminal Value | -20,887 | |||||||||
| Present Terminal Value | -18,236 | |||||||||
| Enterprise Value | -18,724 | |||||||||
| Net Debt | 52,186 | |||||||||
| Equity Value | -70,910 | |||||||||
| Diluted Shares Outstanding, MM | 2,017 | |||||||||
| Equity Value Per Share | -35.15 |
What You Will Receive
- Customizable Excel Template: A fully editable Excel-based DCF Calculator featuring pre-populated financial data for Tianjin Guangyu Development Co., Ltd. (000537SZ).
- Accurate Market Data: Access to historical data and future projections (highlighted in the yellow cells).
- Adjustable Forecast Parameters: Modify key assumptions such as revenue growth, EBITDA percentage, and WACC.
- Instantaneous Calculations: Quickly view how your inputs affect the valuation of Tianjin Guangyu Development Co., Ltd. (000537SZ).
- Professional Development Tool: Designed for investors, CFOs, consultants, and financial analysts.
- User-Centric Interface: Organized for simplicity and ease of navigation, complete with step-by-step guidance.
Key Features
- Comprehensive Financial Data: Gain access to accurate historical financial information and future forecasts for Tianjin Guangyu Development Co., Ltd. (000537SZ).
- Adjustable Forecast Parameters: Modify highlighted cells related to WACC, growth rates, and profit margins to tailor your analysis.
- Automated Calculations: Instant updates to DCF, Net Present Value (NPV), and cash flow assessments for real-time insights.
- User-Friendly Dashboard: Clear and concise visual representations to easily interpret your valuation findings.
- Accessible for All Levels: Designed with a straightforward layout, suitable for investors, CFOs, and consultants alike.
How It Works
- Step 1: Download the Excel file for Tianjin Guangyu Development Co., Ltd. (000537SZ).
- Step 2: Examine the pre-populated financial data and forecasts for Tianjin Guangyu.
- Step 3: Adjust key inputs such as revenue growth, WACC, and tax rates (highlighted cells).
- Step 4: Observe the DCF model refresh in real-time as you modify the assumptions.
- Step 5: Evaluate the outputs and leverage the results for informed investment choices.
Why Choose the Tianjin Guangyu Development Calculator?
- Time-Efficient: Skip the hassle of building a DCF model from scratch – it's pre-configured for your convenience.
- Enhanced Accuracy: Dependable financial data and formulas help minimize valuation errors.
- Fully Customizable: Adapt the model to align with your specific assumptions and projections.
- User-Friendly: Intuitive charts and outputs make analyzing results straightforward.
- Expert-Approved: Crafted for professionals who prioritize accuracy and functionality.
Who Can Benefit from This Product?
- Individual Investors: Gain insights to make informed decisions about investing in Tianjin Guangyu Development Co., Ltd. (000537SZ).
- Financial Analysts: Enhance valuation assessments with accessible financial models tailored for [Symbol].
- Consultants: Provide clients with expert valuation insights on Tianjin Guangyu Development Co., Ltd. (000537SZ) efficiently and accurately.
- Business Owners: Learn the valuation methods used for major companies like Tianjin Guangyu to inform your own business strategies.
- Finance Students: Master valuation techniques through the analysis of real-world data and case studies involving [Symbol].
What the Template Contains
- Historical Data: Features Tianjin Guangyu Development Co., Ltd.'s (000537SZ) past financial information and foundational forecasts.
- DCF and Levered DCF Models: Comprehensive templates designed to assess the intrinsic value of Tianjin Guangyu Development Co., Ltd. (000537SZ).
- WACC Sheet: Includes pre-calculated metrics for the Weighted Average Cost of Capital.
- Editable Inputs: Adjust critical drivers such as growth rates, EBITDA percentages, and capital expenditure forecasts.
- Quarterly and Annual Statements: A detailed overview of the financial performance of Tianjin Guangyu Development Co., Ltd. (000537SZ).
- Interactive Dashboard: Tools for dynamically visualizing valuation results and future projections.
Disclaimer
All information, articles, and product details provided on this website are for general informational and educational purposes only. We do not claim any ownership over, nor do we intend to infringe upon, any trademarks, copyrights, logos, brand names, or other intellectual property mentioned or depicted on this site. Such intellectual property remains the property of its respective owners, and any references here are made solely for identification or informational purposes, without implying any affiliation, endorsement, or partnership.
We make no representations or warranties, express or implied, regarding the accuracy, completeness, or suitability of any content or products presented. Nothing on this website should be construed as legal, tax, investment, financial, medical, or other professional advice. In addition, no part of this site—including articles or product references—constitutes a solicitation, recommendation, endorsement, advertisement, or offer to buy or sell any securities, franchises, or other financial instruments, particularly in jurisdictions where such activity would be unlawful.
All content is of a general nature and may not address the specific circumstances of any individual or entity. It is not a substitute for professional advice or services. Any actions you take based on the information provided here are strictly at your own risk. You accept full responsibility for any decisions or outcomes arising from your use of this website and agree to release us from any liability in connection with your use of, or reliance upon, the content or products found herein.