
|
Addsino Co., Ltd. (000547.sz) Avaliação DCF |
Totalmente Editável: Adapte-Se Às Suas Necessidades No Excel Ou Planilhas
Design Profissional: Modelos Confiáveis E Padrão Da Indústria
Pré-Construídos Para Uso Rápido E Eficiente
Compatível com MAC/PC, totalmente desbloqueado
Não É Necessária Experiência; Fácil De Seguir
Addsino Co., Ltd. (000547.SZ) Bundle
Simplify Addsino Co., Ltd. Avaliação com esta calculadora DCF personalizável! Apresentando a Real Addsino Co., Ltd. Financeiras e insumos de previsão ajustáveis, você pode testar cenários e descobrir a Addsino Co., Ltd. Valor justo em minutos.
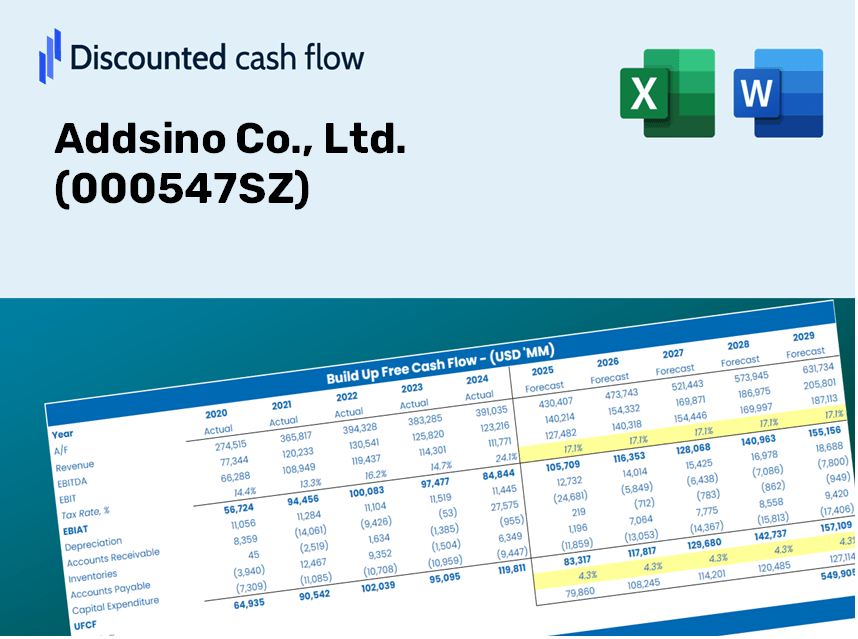
Discounted Cash Flow (DCF) - (USD MM)
| Year | AY1 2020 |
AY2 2021 |
AY3 2022 |
AY4 2023 |
AY5 2024 |
FY1 2025 |
FY2 2026 |
FY3 2027 |
FY4 2028 |
FY5 2029 |
|---|---|---|---|---|---|---|---|---|---|---|
| Revenue | 4,436.0 | 4,143.9 | 3,564.2 | 1,862.6 | 1,868.9 | 1,551.3 | 1,287.6 | 1,068.8 | 887.1 | 736.4 |
| Revenue Growth, % | 0 | -6.59 | -13.99 | -47.74 | 0.33766 | -16.99 | -16.99 | -16.99 | -16.99 | -16.99 |
| EBITDA | 944.9 | 523.6 | 112.5 | -1,413.2 | -1,257.2 | -329.0 | -273.1 | -226.7 | -188.2 | -156.2 |
| EBITDA, % | 21.3 | 12.64 | 3.16 | -75.87 | -67.27 | -21.21 | -21.21 | -21.21 | -21.21 | -21.21 |
| Depreciation | 128.9 | 152.6 | 177.2 | 187.5 | 230.7 | 105.4 | 87.5 | 72.6 | 60.3 | 50.0 |
| Depreciation, % | 2.9 | 3.68 | 4.97 | 10.06 | 12.35 | 6.79 | 6.79 | 6.79 | 6.79 | 6.79 |
| EBIT | 816.0 | 371.0 | -64.7 | -1,600.6 | -1,487.9 | -434.4 | -360.6 | -299.3 | -248.4 | -206.2 |
| EBIT, % | 18.39 | 8.95 | -1.82 | -85.94 | -79.62 | -28 | -28 | -28 | -28 | -28 |
| Total Cash | 2,113.1 | 1,542.0 | 1,837.4 | 1,454.6 | 1,607.7 | 932.4 | 773.9 | 642.4 | 533.2 | 442.6 |
| Total Cash, percent | .0 | .0 | .0 | .0 | .0 | .0 | .0 | .0 | .0 | .0 |
| Account Receivables | 3,349.2 | 3,569.3 | 3,635.5 | 3,109.2 | 2,591.3 | 1,432.2 | 1,188.8 | 986.8 | 819.1 | 679.9 |
| Account Receivables, % | 75.5 | 86.14 | 102 | 166.93 | 138.66 | 92.33 | 92.33 | 92.33 | 92.33 | 92.33 |
| Inventories | 1,204.8 | 1,809.9 | 1,946.0 | 2,256.0 | 2,158.8 | 1,009.7 | 838.1 | 695.6 | 577.4 | 479.3 |
| Inventories, % | 27.16 | 43.68 | 54.6 | 121.12 | 115.52 | 65.09 | 65.09 | 65.09 | 65.09 | 65.09 |
| Accounts Payable | 1,677.0 | 2,347.6 | 1,967.2 | 2,189.3 | 2,311.3 | 1,084.8 | 900.4 | 747.4 | 620.4 | 514.9 |
| Accounts Payable, % | 37.8 | 56.65 | 55.19 | 117.54 | 123.67 | 69.93 | 69.93 | 69.93 | 69.93 | 69.93 |
| Capital Expenditure | -64.3 | -197.9 | -133.9 | -270.4 | -50.1 | -84.3 | -70.0 | -58.1 | -48.2 | -40.0 |
| Capital Expenditure, % | -1.45 | -4.78 | -3.76 | -14.52 | -2.68 | -5.44 | -5.44 | -5.44 | -5.44 | -5.44 |
| Tax Rate, % | 11.9 | 11.9 | 11.9 | 11.9 | 11.9 | 11.9 | 11.9 | 11.9 | 11.9 | 11.9 |
| EBITAT | 689.3 | 347.9 | -51.6 | -1,343.0 | -1,310.9 | -373.6 | -310.1 | -257.4 | -213.7 | -177.4 |
| Depreciation | ||||||||||
| Changes in Account Receivables | ||||||||||
| Changes in Inventories | ||||||||||
| Changes in Accounts Payable | ||||||||||
| Capital Expenditure | ||||||||||
| UFCF | -2,123.1 | 147.9 | -591.1 | -987.5 | -393.2 | 729.2 | -62.0 | -51.5 | -42.7 | -35.5 |
| WACC, % | 7.34 | 7.38 | 7.32 | 7.34 | 7.36 | 7.35 | 7.35 | 7.35 | 7.35 | 7.35 |
| PV UFCF | ||||||||||
| SUM PV UFCF | 526.9 | |||||||||
| Long Term Growth Rate, % | 4.00 | |||||||||
| Free cash flow (T + 1) | -37 | |||||||||
| Terminal Value | -1,100 | |||||||||
| Present Terminal Value | -772 | |||||||||
| Enterprise Value | -245 | |||||||||
| Net Debt | -841 | |||||||||
| Equity Value | 596 | |||||||||
| Diluted Shares Outstanding, MM | 1,593 | |||||||||
| Equity Value Per Share | 0.37 |
Benefits of Using Our Template
- Adjustable Forecast Parameters: Effortlessly modify key inputs (growth %, margins, WACC) to generate various scenarios.
- Real-Time Financial Insights: [Symbol]’s financial data is pre-loaded to facilitate your analysis.
- Instant DCF Calculations: The template automatically computes Net Present Value (NPV) and intrinsic value for you.
- Professional and Tailorable: A sleek Excel model that can be customized to fit your valuation requirements.
- Designed for Analysts and Investors: Perfect for evaluating projections, validating strategies, and enhancing efficiency.
Key Features
- Customizable Financial Inputs: Adjust essential parameters such as revenue growth, EBITDA percentage, and capital expenditures.
- Instant DCF Valuation: Automatically computes intrinsic value, NPV, and additional metrics in real-time.
- High-Accuracy Results: Leverages Addsino Co., Ltd.’s (000547SZ) actual financial data for credible valuation insights.
- Effortless Scenario Analysis: Easily explore various assumptions and assess their impact on results.
- Efficiency-Driven Tool: Streamlines the valuation process, eliminating the need for complex model construction from the ground up.
How It Works
- Download the Template: Gain immediate access to the Excel-based Addsino Co., Ltd. (000547SZ) DCF Calculator.
- Input Your Assumptions: Modify the yellow-highlighted cells for projected growth rates, WACC, profit margins, and other variables.
- Instant Calculations: The model automatically calculates the intrinsic value of Addsino Co., Ltd. (000547SZ).
- Test Scenarios: Experiment with various assumptions to assess potential changes in valuation.
- Analyze and Decide: Utilize the results to inform your investment or financial decisions.
Why Opt for the Addsino Co., Ltd. Calculator?
- Precision: Utilizes real Addsino financial data for enhanced accuracy.
- Versatility: Tailored for users to easily adjust and experiment with various inputs.
- Efficiency: Eliminate the need to create a DCF model from the ground up.
- Expert-Level: Crafted with a focus on the high standards set by CFOs.
- Intuitive Design: Simple to navigate, suitable for those with limited financial modeling skills.
Who Can Benefit from This Product?
- Professional Investors: Create thorough and trustworthy valuation models for portfolio evaluation related to Addsino Co., Ltd. (000547SZ).
- Corporate Finance Teams: Assess valuation scenarios to inform internal decision-making for Addsino Co., Ltd. (000547SZ).
- Consultants and Advisors: Deliver precise valuation insights to clients regarding Addsino Co., Ltd. (000547SZ).
- Students and Educators: Utilize real-time data to enhance financial modeling skills and education focused on Addsino Co., Ltd. (000547SZ).
- Tech Enthusiasts: Gain insights into how technology companies, such as Addsino Co., Ltd. (000547SZ), are valued within the market.
What the Template Contains
- Historical Data: Contains Addsino Co., Ltd.'s (000547SZ) previous financials and foundational forecasts.
- DCF and Levered DCF Models: Comprehensive templates for calculating Addsino Co., Ltd.'s (000547SZ) intrinsic value.
- WACC Sheet: Pre-configured calculations for Weighted Average Cost of Capital.
- Editable Inputs: Adjust key metrics such as growth rates, EBITDA %, and CAPEX assumptions.
- Quarterly and Annual Statements: A detailed overview of Addsino Co., Ltd.'s (000547SZ) financial performance.
- Interactive Dashboard: Dynamically visualize valuation results and projections.
Disclaimer
All information, articles, and product details provided on this website are for general informational and educational purposes only. We do not claim any ownership over, nor do we intend to infringe upon, any trademarks, copyrights, logos, brand names, or other intellectual property mentioned or depicted on this site. Such intellectual property remains the property of its respective owners, and any references here are made solely for identification or informational purposes, without implying any affiliation, endorsement, or partnership.
We make no representations or warranties, express or implied, regarding the accuracy, completeness, or suitability of any content or products presented. Nothing on this website should be construed as legal, tax, investment, financial, medical, or other professional advice. In addition, no part of this site—including articles or product references—constitutes a solicitation, recommendation, endorsement, advertisement, or offer to buy or sell any securities, franchises, or other financial instruments, particularly in jurisdictions where such activity would be unlawful.
All content is of a general nature and may not address the specific circumstances of any individual or entity. It is not a substitute for professional advice or services. Any actions you take based on the information provided here are strictly at your own risk. You accept full responsibility for any decisions or outcomes arising from your use of this website and agree to release us from any liability in connection with your use of, or reliance upon, the content or products found herein.