
|
Baota Industry Co., Ltd. (000595.sz) Avaliação DCF |
Totalmente Editável: Adapte-Se Às Suas Necessidades No Excel Ou Planilhas
Design Profissional: Modelos Confiáveis E Padrão Da Indústria
Pré-Construídos Para Uso Rápido E Eficiente
Compatível com MAC/PC, totalmente desbloqueado
Não É Necessária Experiência; Fácil De Seguir
Baota Industry Co., Ltd. (000595.SZ) Bundle
Como investidor ou analista, esta calculadora DCF [símbolo] é o seu recurso preferido para uma avaliação precisa. Ele vem pré -carregado com dados reais da Baota Industry Co., Ltd., permitindo ajustar as previsões e observar instantaneamente os efeitos.
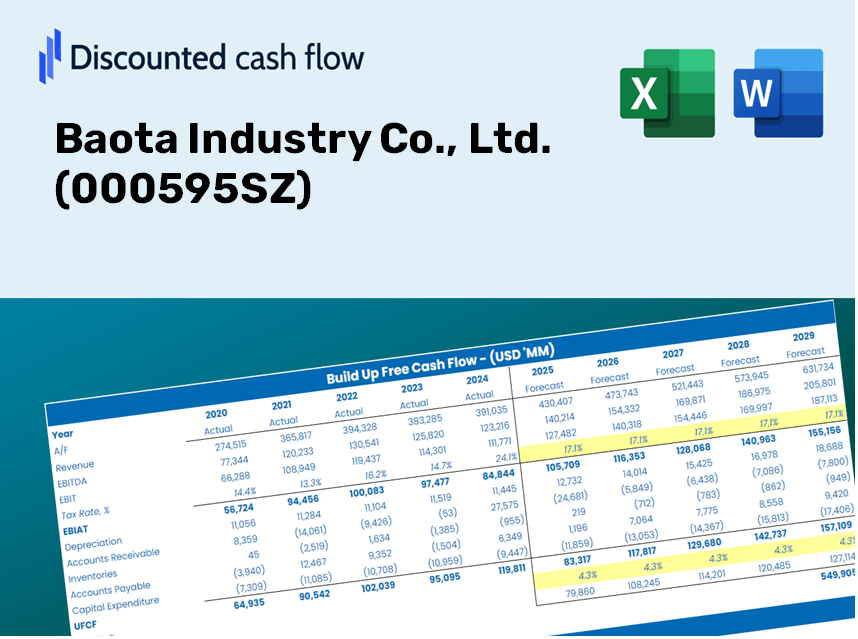
Discounted Cash Flow (DCF) - (USD MM)
| Year | AY1 2020 |
AY2 2021 |
AY3 2022 |
AY4 2023 |
AY5 2024 |
FY1 2025 |
FY2 2026 |
FY3 2027 |
FY4 2028 |
FY5 2029 |
|---|---|---|---|---|---|---|---|---|---|---|
| Revenue | 204.9 | 174.8 | 250.4 | 297.9 | 237.0 | 253.0 | 270.2 | 288.5 | 308.0 | 328.9 |
| Revenue Growth, % | 0 | -14.71 | 43.28 | 18.98 | -20.46 | 6.77 | 6.77 | 6.77 | 6.77 | 6.77 |
| EBITDA | 79.5 | -127.0 | -40.5 | -116.5 | -123.6 | -71.5 | -76.3 | -81.5 | -87.0 | -92.9 |
| EBITDA, % | 38.82 | -72.67 | -16.15 | -39.12 | -52.16 | -28.26 | -28.26 | -28.26 | -28.26 | -28.26 |
| Depreciation | 45.1 | 45.1 | 42.5 | 37.5 | 33.2 | 46.2 | 49.4 | 52.7 | 56.3 | 60.1 |
| Depreciation, % | 22 | 25.81 | 16.96 | 12.58 | 14.02 | 18.28 | 18.28 | 18.28 | 18.28 | 18.28 |
| EBIT | 34.5 | -172.1 | -82.9 | -154.0 | -156.8 | -117.7 | -125.7 | -134.2 | -143.3 | -153.0 |
| EBIT, % | 16.82 | -98.48 | -33.11 | -51.7 | -66.18 | -46.53 | -46.53 | -46.53 | -46.53 | -46.53 |
| Total Cash | 375.5 | 244.3 | 128.0 | 100.5 | 52.1 | 155.3 | 165.8 | 177.0 | 189.0 | 201.8 |
| Total Cash, percent | .0 | .0 | .0 | .0 | .0 | .0 | .0 | .0 | .0 | .0 |
| Account Receivables | 261.7 | 224.3 | 252.8 | 262.9 | 220.2 | 243.5 | 260.0 | 277.6 | 296.4 | 316.5 |
| Account Receivables, % | 127.72 | 128.37 | 100.94 | 88.23 | 92.94 | 96.23 | 96.23 | 96.23 | 96.23 | 96.23 |
| Inventories | 195.7 | 188.0 | 204.0 | 180.2 | 170.3 | 207.1 | 221.1 | 236.1 | 252.1 | 269.2 |
| Inventories, % | 95.49 | 107.59 | 81.46 | 60.48 | 71.86 | 81.86 | 81.86 | 81.86 | 81.86 | 81.86 |
| Accounts Payable | 25.3 | 43.2 | 61.0 | 60.7 | 69.2 | 56.2 | 60.0 | 64.0 | 68.4 | 73.0 |
| Accounts Payable, % | 12.34 | 24.71 | 24.37 | 20.38 | 29.22 | 22.2 | 22.2 | 22.2 | 22.2 | 22.2 |
| Capital Expenditure | -.3 | -15.9 | -17.4 | -13.0 | -37.5 | -18.4 | -19.7 | -21.0 | -22.4 | -23.9 |
| Capital Expenditure, % | -0.13866 | -9.12 | -6.94 | -4.37 | -15.8 | -7.28 | -7.28 | -7.28 | -7.28 | -7.28 |
| Tax Rate, % | -0.7929 | -0.7929 | -0.7929 | -0.7929 | -0.7929 | -0.7929 | -0.7929 | -0.7929 | -0.7929 | -0.7929 |
| EBITAT | 22.4 | -170.8 | -83.8 | -157.0 | -158.1 | -109.3 | -116.7 | -124.6 | -133.1 | -142.1 |
| Depreciation | ||||||||||
| Changes in Account Receivables | ||||||||||
| Changes in Inventories | ||||||||||
| Changes in Accounts Payable | ||||||||||
| Capital Expenditure | ||||||||||
| UFCF | -364.9 | -78.8 | -85.3 | -119.1 | -101.3 | -154.6 | -113.7 | -121.4 | -129.7 | -138.4 |
| WACC, % | 7.23 | 7.29 | 7.29 | 7.29 | 7.29 | 7.28 | 7.28 | 7.28 | 7.28 | 7.28 |
| PV UFCF | ||||||||||
| SUM PV UFCF | -536.6 | |||||||||
| Long Term Growth Rate, % | 2.00 | |||||||||
| Free cash flow (T + 1) | -141 | |||||||||
| Terminal Value | -2,675 | |||||||||
| Present Terminal Value | -1,882 | |||||||||
| Enterprise Value | -2,419 | |||||||||
| Net Debt | 248 | |||||||||
| Equity Value | -2,667 | |||||||||
| Diluted Shares Outstanding, MM | 1,114 | |||||||||
| Equity Value Per Share | -2.40 |
Benefits of Choosing Baota Industry Co., Ltd. (000595SZ)
- Customizable Excel Template: An adaptable Excel-based DCF Calculator featuring pre-populated real financials for Baota Industry Co., Ltd.
- Accurate Data: Historical performance data and forward-looking projections (displayed in the highlighted cells).
- Assumption Flexibility: Easily modify key forecast assumptions such as revenue growth, EBITDA margin, and WACC.
- Instant Calculations: Quickly observe how your inputs affect the valuation of Baota Industry Co., Ltd.
- Professional Resource: Designed specifically for investors, CFOs, consultants, and financial analysts.
- Intuitive Layout: Organized for simplicity and user-friendliness, complete with step-by-step guidance.
Key Features
- 🔍 Real-Life [Symbol] Financials: Pre-loaded historical and forecasted data for Baota Industry Co., Ltd.
- ✏️ Fully Customizable Inputs: Modify all essential parameters (yellow cells) such as WACC, growth %, and tax rates.
- 📊 Professional DCF Valuation: Integrated formulas assess Baota's intrinsic value using the Discounted Cash Flow methodology.
- ⚡ Instant Results: View Baota's valuation immediately after adjustments.
- Scenario Analysis: Evaluate and compare outcomes for different financial assumptions side-by-side.
How It Functions
- Step 1: Download the Excel spreadsheet.
- Step 2: Examine the pre-filled data for Baota Industry Co., Ltd. (000595SZ), including historical and forecasted figures.
- Step 3: Modify key assumptions (highlighted in yellow) based on your insights.
- Step 4: Observe the automatic updates for Baota Industry's intrinsic value.
- Step 5: Utilize the results for investment decisions or financial reporting.
Why Choose Baota Industry Co., Ltd. (000595SZ) Calculator?
- Precision: Utilizes authentic Baota financials for reliable data accuracy.
- Adaptability: Tailored for users to easily experiment and adjust inputs as needed.
- Efficiency: Eliminate the need to create a DCF model from the ground up.
- Expert-Level: Crafted with the precision and functionality expected by top financial executives.
- Intuitive Interface: Simple to navigate, making it accessible for users with basic financial knowledge.
Who Should Utilize Baota Industry Co., Ltd.?
- Individual Investors: Make informed choices regarding the purchase or sale of Baota Industry Co., Ltd. (000595SZ) shares.
- Financial Analysts: Enhance valuation workflows with pre-built financial models tailored for Baota Industry Co., Ltd. (000595SZ).
- Consultants: Provide clients with accurate and efficient valuation insights related to Baota Industry Co., Ltd. (000595SZ).
- Business Owners: Gain insights into how companies like Baota Industry Co., Ltd. (000595SZ) are valued to inform your own business strategies.
- Finance Students: Acquire valuation skills using real-world examples and data from Baota Industry Co., Ltd. (000595SZ).
Contents of the Template
- Comprehensive DCF Model: An editable template featuring in-depth valuation calculations.
- Real-World Data: Historical and projected financial information for Baota Industry Co., Ltd. (000595SZ) preloaded for analysis.
- Customizable Parameters: Modify WACC, growth rates, and tax assumptions to explore various scenarios.
- Financial Statements: Complete annual and quarterly breakdowns for enhanced insights.
- Key Ratios: Integrated analysis of profitability, efficiency, and leverage metrics.
- Dashboard with Visual Outputs: Charts and tables designed for clear and actionable insights.
Disclaimer
All information, articles, and product details provided on this website are for general informational and educational purposes only. We do not claim any ownership over, nor do we intend to infringe upon, any trademarks, copyrights, logos, brand names, or other intellectual property mentioned or depicted on this site. Such intellectual property remains the property of its respective owners, and any references here are made solely for identification or informational purposes, without implying any affiliation, endorsement, or partnership.
We make no representations or warranties, express or implied, regarding the accuracy, completeness, or suitability of any content or products presented. Nothing on this website should be construed as legal, tax, investment, financial, medical, or other professional advice. In addition, no part of this site—including articles or product references—constitutes a solicitation, recommendation, endorsement, advertisement, or offer to buy or sell any securities, franchises, or other financial instruments, particularly in jurisdictions where such activity would be unlawful.
All content is of a general nature and may not address the specific circumstances of any individual or entity. It is not a substitute for professional advice or services. Any actions you take based on the information provided here are strictly at your own risk. You accept full responsibility for any decisions or outcomes arising from your use of this website and agree to release us from any liability in connection with your use of, or reliance upon, the content or products found herein.