
|
Anhui Gujing Distillery Co., Ltd. (000596.sz) Avaliação DCF |
Totalmente Editável: Adapte-Se Às Suas Necessidades No Excel Ou Planilhas
Design Profissional: Modelos Confiáveis E Padrão Da Indústria
Pré-Construídos Para Uso Rápido E Eficiente
Compatível com MAC/PC, totalmente desbloqueado
Não É Necessária Experiência; Fácil De Seguir
Anhui Gujing Distillery Co., Ltd. (000596.SZ) Bundle
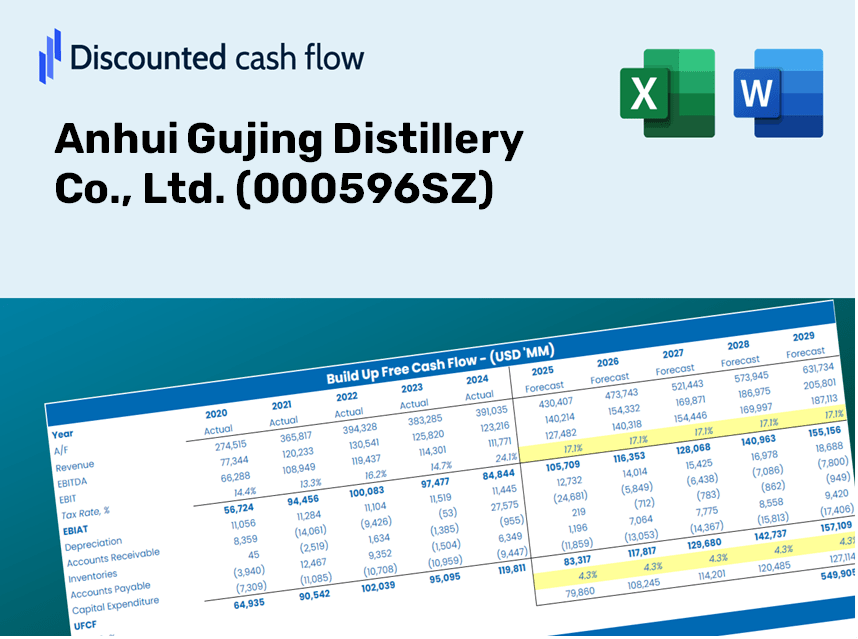
Simplifique a Anhui Gujing Distillery Co., Ltd. (000596SZ) com esta calculadora DCF personalizável! Com a Real Anhui Gujing Distillery Co., Ltd. (000596SZ) e entradas de previsão ajustáveis, você pode testar cenários e descobrir o valor justo Anhui Gujing Distillery Co., Ltd. (000596SZ) em minutos.
Discounted Cash Flow (DCF) - (USD MM)
| Year | AY1 2020 |
AY2 2021 |
AY3 2022 |
AY4 2023 |
AY5 2024 |
FY1 2025 |
FY2 2026 |
FY3 2027 |
FY4 2028 |
FY5 2029 |
|---|---|---|---|---|---|---|---|---|---|---|
| Revenue | 10,292.1 | 13,269.8 | 16,713.2 | 20,253.5 | 23,577.9 | 29,029.0 | 35,740.4 | 44,003.5 | 54,176.9 | 66,702.3 |
| Revenue Growth, % | 0 | 28.93 | 25.95 | 21.18 | 16.41 | 23.12 | 23.12 | 23.12 | 23.12 | 23.12 |
| EBITDA | 2,387.9 | 3,095.4 | 4,441.0 | 6,409.7 | 7,879.9 | 8,021.8 | 9,876.4 | 12,159.7 | 14,971.0 | 18,432.2 |
| EBITDA, % | 23.2 | 23.33 | 26.57 | 31.65 | 33.42 | 27.63 | 27.63 | 27.63 | 27.63 | 27.63 |
| Depreciation | 248.5 | 267.0 | 269.0 | 345.6 | 502.7 | 573.3 | 705.9 | 869.0 | 1,070.0 | 1,317.3 |
| Depreciation, % | 2.41 | 2.01 | 1.61 | 1.71 | 2.13 | 1.97 | 1.97 | 1.97 | 1.97 | 1.97 |
| EBIT | 2,139.4 | 2,828.4 | 4,172.0 | 6,064.0 | 7,377.2 | 7,448.5 | 9,170.5 | 11,290.7 | 13,901.0 | 17,114.9 |
| EBIT, % | 20.79 | 21.31 | 24.96 | 29.94 | 31.29 | 25.66 | 25.66 | 25.66 | 25.66 | 25.66 |
| Total Cash | 6,175.1 | 14,586.0 | 15,555.2 | 16,686.4 | 15,954.3 | 23,404.6 | 28,815.6 | 35,477.7 | 43,680.0 | 53,778.6 |
| Total Cash, percent | .0 | .0 | .0 | .0 | .0 | .0 | .0 | .0 | .0 | .0 |
| Account Receivables | 1,741.4 | 706.0 | 355.3 | 1,075.3 | 3,123.4 | 2,492.0 | 3,068.2 | 3,777.5 | 4,650.9 | 5,726.1 |
| Account Receivables, % | 16.92 | 5.32 | 2.13 | 5.31 | 13.25 | 8.58 | 8.58 | 8.58 | 8.58 | 8.58 |
| Inventories | 3,416.9 | 4,663.5 | 6,058.1 | 7,519.7 | 9,264.2 | 10,509.1 | 12,938.7 | 15,930.1 | 19,613.1 | 24,147.5 |
| Inventories, % | 33.2 | 35.14 | 36.25 | 37.13 | 39.29 | 36.2 | 36.2 | 36.2 | 36.2 | 36.2 |
| Accounts Payable | 645.8 | 1,147.6 | 2,749.8 | 4,167.4 | 3,531.7 | 3,885.9 | 4,784.3 | 5,890.4 | 7,252.2 | 8,928.8 |
| Accounts Payable, % | 6.27 | 8.65 | 16.45 | 20.58 | 14.98 | 13.39 | 13.39 | 13.39 | 13.39 | 13.39 |
| Capital Expenditure | -561.6 | -578.2 | -1,580.2 | -2,381.0 | -2,427.4 | -2,399.0 | -2,953.6 | -3,636.4 | -4,477.2 | -5,512.3 |
| Capital Expenditure, % | -5.46 | -4.36 | -9.45 | -11.76 | -10.3 | -8.26 | -8.26 | -8.26 | -8.26 | -8.26 |
| Tax Rate, % | 29.23 | 29.23 | 29.23 | 29.23 | 29.23 | 29.23 | 29.23 | 29.23 | 29.23 | 29.23 |
| EBITAT | 1,603.9 | 2,049.4 | 2,933.3 | 4,394.9 | 5,221.1 | 5,377.5 | 6,620.8 | 8,151.5 | 10,036.1 | 12,356.4 |
| Depreciation | ||||||||||
| Changes in Account Receivables | ||||||||||
| Changes in Inventories | ||||||||||
| Changes in Accounts Payable | ||||||||||
| Capital Expenditure | ||||||||||
| UFCF | -3,221.7 | 2,028.9 | 2,180.3 | 1,595.4 | -1,131.9 | 3,292.6 | 2,265.7 | 2,789.5 | 3,434.4 | 4,228.4 |
| WACC, % | 6.36 | 6.36 | 6.36 | 6.36 | 6.36 | 6.36 | 6.36 | 6.36 | 6.36 | 6.36 |
| PV UFCF | ||||||||||
| SUM PV UFCF | 13,208.2 | |||||||||
| Long Term Growth Rate, % | 3.50 | |||||||||
| Free cash flow (T + 1) | 4,376 | |||||||||
| Terminal Value | 153,153 | |||||||||
| Present Terminal Value | 112,534 | |||||||||
| Enterprise Value | 125,742 | |||||||||
| Net Debt | -15,718 | |||||||||
| Equity Value | 141,460 | |||||||||
| Diluted Shares Outstanding, MM | 528 | |||||||||
| Equity Value Per Share | 267.68 |
What You Will Receive
- Customizable Forecast Inputs: Easily adjust assumptions (growth %, margins, WACC) to create various scenarios.
- Real-Time Data: Anhui Gujing Distillery Co., Ltd. (000596SZ) financial data pre-loaded to streamline your analysis.
- Automated DCF Outputs: The template computes Net Present Value (NPV) and intrinsic value effortlessly.
- Professional and Adaptable: A refined Excel model tailored to your valuation requirements.
- Designed for Analysts and Investors: Perfect for assessing projections, validating strategies, and enhancing efficiency.
Key Features
- Comprehensive DCF Calculator: Offers in-depth unlevered and levered DCF valuation models tailored for Anhui Gujing Distillery Co., Ltd. (000596SZ).
- WACC Calculator: Features a pre-configured Weighted Average Cost of Capital sheet with adjustable inputs for precise calculations.
- Customizable Forecast Assumptions: Easily adjust growth rates, capital investments, and discount rates to suit your analysis.
- Integrated Financial Ratios: Evaluate profitability, leverage, and efficiency ratios specifically for Anhui Gujing Distillery Co., Ltd. (000596SZ).
- Interactive Dashboard and Visualizations: Graphical representations of essential valuation metrics for straightforward assessment.
How It Works
- Download: Retrieve the pre-prepared Excel file containing Anhui Gujing Distillery Co., Ltd.'s financial data.
- Customize: Modify projections, such as revenue growth, EBITDA %, and WACC.
- Update Automatically: Watch as the intrinsic value and NPV calculations refresh in real-time.
- Test Scenarios: Generate various projections and instantly compare the results.
- Make Decisions: Utilize the valuation findings to inform your investment approach.
Why Opt for This Calculator?
- Precise Data: Updated financial information for Anhui Gujing Distillery Co., Ltd. ensures dependable valuation outcomes.
- Flexible: Modify essential parameters such as growth rates, WACC, and tax rates to align with your forecasts.
- Efficient: Pre-configured calculations save you the time of building from the ground up.
- Professional-Quality Tool: Tailored for investors, analysts, and consultants alike.
- Easy to Use: A clear layout and straightforward instructions cater to users of all experience levels.
Who Can Benefit from This Product?
- Professional Investors: Create comprehensive and trustworthy valuation models for analyzing portfolios featuring Anhui Gujing Distillery Co., Ltd. (000596SZ).
- Corporate Finance Teams: Evaluate valuation scenarios to inform strategic decisions within the organization.
- Consultants and Advisors: Deliver precise valuation insights on Anhui Gujing Distillery Co., Ltd. (000596SZ) to clients.
- Students and Educators: Utilize real-world data for learning and practicing financial modeling techniques.
- Industry Enthusiasts: Gain insights into the market valuation processes for beverage companies like Anhui Gujing Distillery Co., Ltd. (000596SZ).
Contents of the Template
- Operating and Balance Sheet Data: Pre-filled historical data and forecasts for Anhui Gujing Distillery Co., Ltd. (000596SZ), including revenue, EBITDA, EBIT, and capital expenditures.
- WACC Calculation: A dedicated sheet for calculating the Weighted Average Cost of Capital (WACC), featuring parameters such as Beta, risk-free rate, and share price.
- DCF Valuation (Unlevered and Levered): Customizable Discounted Cash Flow models displaying intrinsic value with comprehensive calculations.
- Financial Statements: Pre-loaded financial statements (both annual and quarterly) to facilitate in-depth analysis.
- Key Ratios: A collection of profitability, leverage, and efficiency ratios pertinent to Anhui Gujing Distillery Co., Ltd. (000596SZ).
- Dashboard and Charts: A visual overview of valuation outputs and assumptions, enabling straightforward analysis of results.
Disclaimer
All information, articles, and product details provided on this website are for general informational and educational purposes only. We do not claim any ownership over, nor do we intend to infringe upon, any trademarks, copyrights, logos, brand names, or other intellectual property mentioned or depicted on this site. Such intellectual property remains the property of its respective owners, and any references here are made solely for identification or informational purposes, without implying any affiliation, endorsement, or partnership.
We make no representations or warranties, express or implied, regarding the accuracy, completeness, or suitability of any content or products presented. Nothing on this website should be construed as legal, tax, investment, financial, medical, or other professional advice. In addition, no part of this site—including articles or product references—constitutes a solicitation, recommendation, endorsement, advertisement, or offer to buy or sell any securities, franchises, or other financial instruments, particularly in jurisdictions where such activity would be unlawful.
All content is of a general nature and may not address the specific circumstances of any individual or entity. It is not a substitute for professional advice or services. Any actions you take based on the information provided here are strictly at your own risk. You accept full responsibility for any decisions or outcomes arising from your use of this website and agree to release us from any liability in connection with your use of, or reliance upon, the content or products found herein.