
|
Mongólia Interior Yuan Xing Energy Co., Ltd (000683.sz) Avaliação DCF |
Totalmente Editável: Adapte-Se Às Suas Necessidades No Excel Ou Planilhas
Design Profissional: Modelos Confiáveis E Padrão Da Indústria
Pré-Construídos Para Uso Rápido E Eficiente
Compatível com MAC/PC, totalmente desbloqueado
Não É Necessária Experiência; Fácil De Seguir
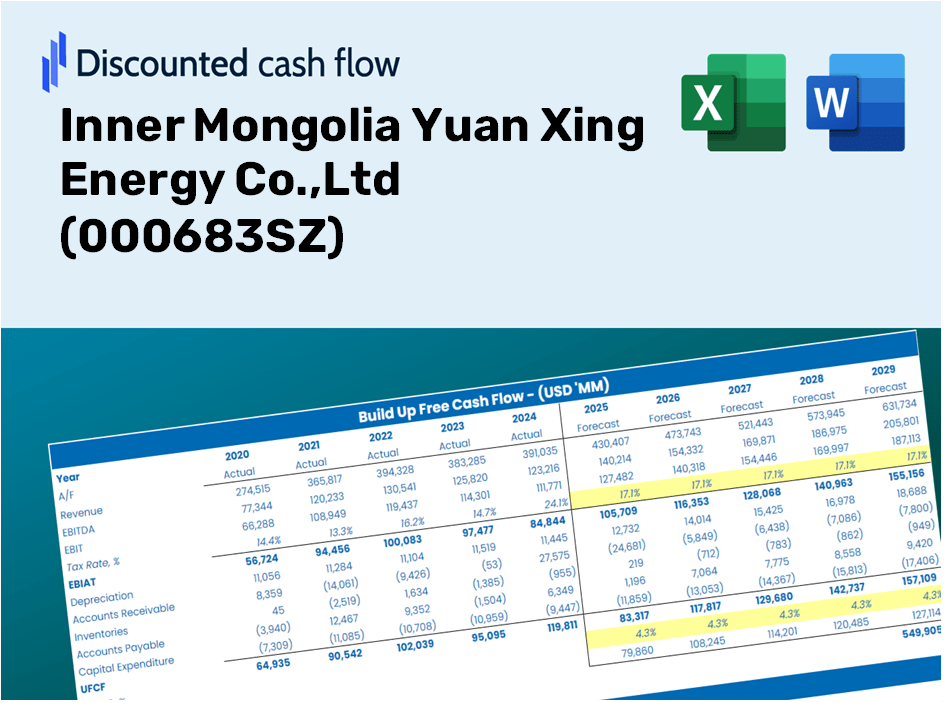
Inner Mongolia Yuan Xing Energy Co.,Ltd (000683.SZ) Bundle
Simplifique sua análise e melhore a precisão com a nossa calculadora DCF (000683SZ)! Alimentado pela autêntica Mongólia Interior Yuan Xing Energy Co., LTD Dados e suposições personalizáveis, essa ferramenta permite prever, analisar e valorizar a Mongolia Yuan Xing Energy Co., Ltd, como um investidor especialista.
Discounted Cash Flow (DCF) - (USD MM)
| Year | AY1 2020 |
AY2 2021 |
AY3 2022 |
AY4 2023 |
AY5 2024 |
FY1 2025 |
FY2 2026 |
FY3 2027 |
FY4 2028 |
FY5 2029 |
|---|---|---|---|---|---|---|---|---|---|---|
| Revenue | 7,698.1 | 12,145.5 | 10,986.5 | 12,043.6 | 13,263.9 | 15,518.3 | 18,155.8 | 21,241.6 | 24,851.9 | 29,075.8 |
| Revenue Growth, % | 0 | 57.77 | -9.54 | 9.62 | 10.13 | 17 | 17 | 17 | 17 | 17 |
| EBITDA | 1,571.0 | 4,467.3 | 3,993.3 | 4,541.2 | 5,191.4 | 5,288.1 | 6,186.9 | 7,238.4 | 8,468.7 | 9,908.0 |
| EBITDA, % | 20.41 | 36.78 | 36.35 | 37.71 | 39.14 | 34.08 | 34.08 | 34.08 | 34.08 | 34.08 |
| Depreciation | 1,064.3 | 1,092.0 | 879.7 | 1,046.2 | 1,489.6 | 1,574.8 | 1,842.5 | 2,155.6 | 2,522.0 | 2,950.7 |
| Depreciation, % | 13.83 | 8.99 | 8.01 | 8.69 | 11.23 | 10.15 | 10.15 | 10.15 | 10.15 | 10.15 |
| EBIT | 506.7 | 3,375.3 | 3,113.7 | 3,495.0 | 3,701.8 | 3,713.3 | 4,344.4 | 5,082.8 | 5,946.7 | 6,957.4 |
| EBIT, % | 6.58 | 27.79 | 28.34 | 29.02 | 27.91 | 23.93 | 23.93 | 23.93 | 23.93 | 23.93 |
| Total Cash | 1,580.5 | 4,865.2 | 2,090.3 | 3,568.1 | 3,965.5 | 4,318.4 | 5,052.3 | 5,911.0 | 6,915.7 | 8,091.1 |
| Total Cash, percent | .0 | .0 | .0 | .0 | .0 | .0 | .0 | .0 | .0 | .0 |
| Account Receivables | 573.9 | 1,499.6 | 874.6 | 1,226.7 | 339.7 | 1,257.3 | 1,471.0 | 1,721.0 | 2,013.5 | 2,355.7 |
| Account Receivables, % | 7.46 | 12.35 | 7.96 | 10.19 | 2.56 | 8.1 | 8.1 | 8.1 | 8.1 | 8.1 |
| Inventories | 374.8 | 675.6 | 776.3 | 534.8 | 772.4 | 861.6 | 1,008.0 | 1,179.4 | 1,379.8 | 1,614.3 |
| Inventories, % | 4.87 | 5.56 | 7.07 | 4.44 | 5.82 | 5.55 | 5.55 | 5.55 | 5.55 | 5.55 |
| Accounts Payable | 3,630.4 | 2,877.3 | 4,931.7 | 3,109.9 | 2,357.3 | 4,945.2 | 5,785.7 | 6,769.0 | 7,919.5 | 9,265.5 |
| Accounts Payable, % | 47.16 | 23.69 | 44.89 | 25.82 | 17.77 | 31.87 | 31.87 | 31.87 | 31.87 | 31.87 |
| Capital Expenditure | -816.6 | -1,811.7 | -3,272.4 | -3,680.5 | -1,338.7 | -2,978.3 | -3,484.5 | -4,076.8 | -4,769.7 | -5,580.3 |
| Capital Expenditure, % | -10.61 | -14.92 | -29.79 | -30.56 | -10.09 | -19.19 | -19.19 | -19.19 | -19.19 | -19.19 |
| Tax Rate, % | 46.77 | 46.77 | 46.77 | 46.77 | 46.77 | 46.77 | 46.77 | 46.77 | 46.77 | 46.77 |
| EBITAT | 139.9 | 2,647.0 | 2,263.8 | 1,858.2 | 1,970.5 | 2,117.7 | 2,477.6 | 2,898.7 | 3,391.3 | 3,967.7 |
| Depreciation | ||||||||||
| Changes in Account Receivables | ||||||||||
| Changes in Inventories | ||||||||||
| Changes in Accounts Payable | ||||||||||
| Capital Expenditure | ||||||||||
| UFCF | 3,069.4 | -52.2 | 2,449.8 | -2,708.5 | 2,018.2 | 2,295.2 | 1,315.9 | 1,539.5 | 1,801.2 | 2,107.3 |
| WACC, % | 5.73 | 6.49 | 6.4 | 6.11 | 6.11 | 6.17 | 6.17 | 6.17 | 6.17 | 6.17 |
| PV UFCF | ||||||||||
| SUM PV UFCF | 7,595.8 | |||||||||
| Long Term Growth Rate, % | 0.50 | |||||||||
| Free cash flow (T + 1) | 2,118 | |||||||||
| Terminal Value | 37,366 | |||||||||
| Present Terminal Value | 27,702 | |||||||||
| Enterprise Value | 35,298 | |||||||||
| Net Debt | 1,755 | |||||||||
| Equity Value | 33,542 | |||||||||
| Diluted Shares Outstanding, MM | 3,696 | |||||||||
| Equity Value Per Share | 9.07 |
Benefits You Will Receive
- Authentic 000683SZ Financial Data: Access to both historical records and projected figures for precise valuation.
- Customizable Parameters: Adjust WACC, tax rates, revenue growth, and capital expenses to suit your analysis.
- Dynamic Calculations: Automatically computes intrinsic value and NPV in real-time.
- Scenario Evaluation: Analyze various scenarios to assess the future outlook of Inner Mongolia Yuan Xing Energy Co., Ltd.
- User-Friendly Interface: Designed for industry professionals while remaining approachable for newcomers.
Key Features
- Customizable Forecast Settings: Adjust essential variables such as revenue growth, EBITDA %, and capital expenditures tailored for Inner Mongolia Yuan Xing Energy Co., Ltd (000683SZ).
- Instant DCF Valuation: Quickly computes intrinsic value, NPV, and other critical metrics automatically.
- High Precision Accuracy: Leverages real financial data from Inner Mongolia Yuan Xing Energy Co., Ltd (000683SZ) for dependable valuation results.
- Simplified Scenario Analysis: Effortlessly explore various assumptions and assess their impacts side by side.
- Efficiency Booster: Remove the hassle of constructing intricate valuation models from ground zero.
How It Functions
- Download: Obtain the pre-configured Excel file containing Inner Mongolia Yuan Xing Energy Co., Ltd's financial data.
- Customize: Modify forecasts, including revenue growth, EBITDA %, and WACC.
- Automatic Updates: The intrinsic value and NPV calculations refresh in real-time.
- Scenario Testing: Develop various projections and instantly compare results.
- Make Informed Choices: Utilize the valuation results to shape your investment decisions.
Why Choose This Calculator for Inner Mongolia Yuan Xing Energy Co., Ltd (000683SZ)?
- All-in-One Solution: This tool integrates DCF, WACC, and financial ratio analyses seamlessly.
- Adjustable Inputs: Modify the yellow-highlighted cells to explore different financial scenarios.
- In-Depth Analysis: Automatically computes the intrinsic value and Net Present Value of Inner Mongolia Yuan Xing Energy Co., Ltd (000683SZ).
- Preloaded Information: Comes with historical and projected data for reliable analysis.
- Top-Notch Quality: Perfect for finance professionals, investors, and business consultants alike.
Who Should Consider This Product?
- Investors: Accurately assess the fair value of Inner Mongolia Yuan Xing Energy Co., Ltd (000683SZ) before making investment choices.
- CFOs: Utilize a top-tier DCF model for comprehensive financial reporting and analysis.
- Consultants: Effortlessly customize the template for valuation reports tailored to clients.
- Entrepreneurs: Acquire valuable insights into the financial modeling techniques employed by leading energy firms.
- Educators: Employ this resource as a teaching aid to illustrate various valuation methodologies.
Contents of the Template
- Preloaded 000683SZ Data: Historical and projected financial information, including revenue, EBIT, and capital expenditures.
- DCF and WACC Models: Advanced spreadsheets for determining intrinsic value and Weighted Average Cost of Capital.
- Editable Inputs: Yellow-highlighted fields for modifying revenue growth, tax rates, and discount rates.
- Financial Statements: Detailed annual and quarterly financials for comprehensive analysis.
- Key Ratios: Metrics on profitability, leverage, and efficiency to assess performance.
- Dashboard and Charts: Visual representations of valuation results and underlying assumptions.
Disclaimer
All information, articles, and product details provided on this website are for general informational and educational purposes only. We do not claim any ownership over, nor do we intend to infringe upon, any trademarks, copyrights, logos, brand names, or other intellectual property mentioned or depicted on this site. Such intellectual property remains the property of its respective owners, and any references here are made solely for identification or informational purposes, without implying any affiliation, endorsement, or partnership.
We make no representations or warranties, express or implied, regarding the accuracy, completeness, or suitability of any content or products presented. Nothing on this website should be construed as legal, tax, investment, financial, medical, or other professional advice. In addition, no part of this site—including articles or product references—constitutes a solicitation, recommendation, endorsement, advertisement, or offer to buy or sell any securities, franchises, or other financial instruments, particularly in jurisdictions where such activity would be unlawful.
All content is of a general nature and may not address the specific circumstances of any individual or entity. It is not a substitute for professional advice or services. Any actions you take based on the information provided here are strictly at your own risk. You accept full responsibility for any decisions or outcomes arising from your use of this website and agree to release us from any liability in connection with your use of, or reliance upon, the content or products found herein.