
|
Qinghai Salt Lake Industry Co., Ltd (000792.SZ) Avaliação DCF |
Totalmente Editável: Adapte-Se Às Suas Necessidades No Excel Ou Planilhas
Design Profissional: Modelos Confiáveis E Padrão Da Indústria
Pré-Construídos Para Uso Rápido E Eficiente
Compatível com MAC/PC, totalmente desbloqueado
Não É Necessária Experiência; Fácil De Seguir
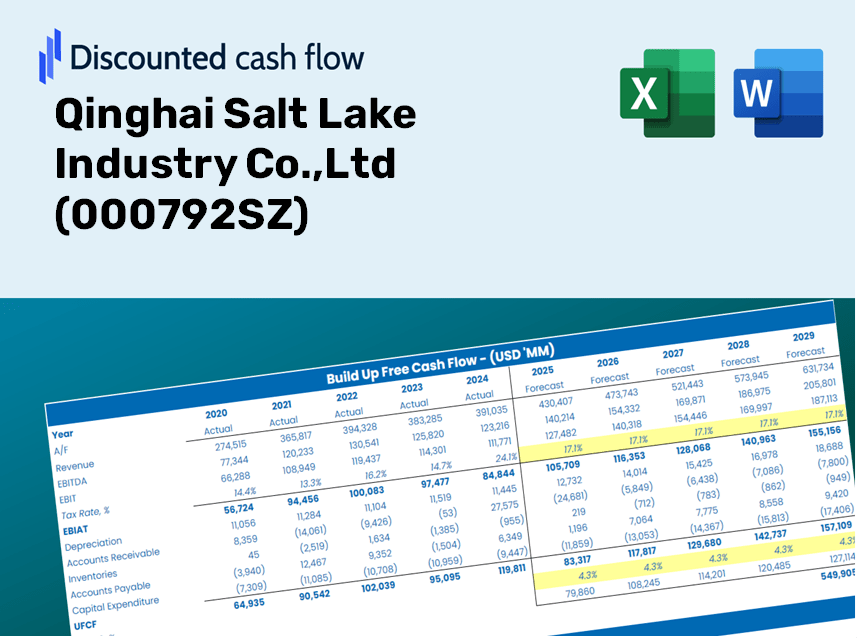
Qinghai Salt Lake Industry Co.,Ltd (000792.SZ) Bundle
Projetado para precisão, a nossa calculadora DCF (000792SZ) permite avaliar a avaliação da Indústria da Qinghai Salt Lake Co., LTD usando dados financeiros do mundo real e completa flexibilidade para modificar todos os parâmetros essenciais para obter projeções aprimoradas.
Discounted Cash Flow (DCF) - (USD MM)
| Year | AY1 2020 |
AY2 2021 |
AY3 2022 |
AY4 2023 |
AY5 2024 |
FY1 2025 |
FY2 2026 |
FY3 2027 |
FY4 2028 |
FY5 2029 |
|---|---|---|---|---|---|---|---|---|---|---|
| Revenue | 14,002.6 | 14,717.7 | 30,739.5 | 21,578.5 | 15,134.1 | 16,853.4 | 18,767.9 | 20,899.9 | 23,274.1 | 25,918.1 |
| Revenue Growth, % | 0 | 5.11 | 108.86 | -29.8 | -29.86 | 11.36 | 11.36 | 11.36 | 11.36 | 11.36 |
| EBITDA | 5,027.4 | 7,362.7 | 22,164.6 | 10,667.0 | 6,150.9 | 8,363.0 | 9,313.0 | 10,371.0 | 11,549.1 | 12,861.1 |
| EBITDA, % | 35.9 | 50.03 | 72.1 | 49.43 | 40.64 | 49.62 | 49.62 | 49.62 | 49.62 | 49.62 |
| Depreciation | 611.2 | 723.6 | 700.2 | 763.5 | 807.0 | 688.6 | 766.8 | 854.0 | 951.0 | 1,059.0 |
| Depreciation, % | 4.36 | 4.92 | 2.28 | 3.54 | 5.33 | 4.09 | 4.09 | 4.09 | 4.09 | 4.09 |
| EBIT | 4,416.3 | 6,639.1 | 21,464.4 | 9,903.5 | 5,344.0 | 7,674.4 | 8,546.2 | 9,517.0 | 10,598.2 | 11,802.1 |
| EBIT, % | 31.54 | 45.11 | 69.83 | 45.9 | 35.31 | 45.54 | 45.54 | 45.54 | 45.54 | 45.54 |
| Total Cash | 2,069.7 | 6,555.2 | 18,627.9 | 21,379.7 | 15,628.9 | 10,752.4 | 11,973.9 | 13,334.1 | 14,848.8 | 16,535.7 |
| Total Cash, percent | .0 | .0 | .0 | .0 | .0 | .0 | .0 | .0 | .0 | .0 |
| Account Receivables | 3,209.2 | 3,918.4 | 8,141.6 | 7,287.3 | 4,665.5 | 4,740.1 | 5,278.5 | 5,878.2 | 6,545.9 | 7,289.6 |
| Account Receivables, % | 22.92 | 26.62 | 26.49 | 33.77 | 30.83 | 28.13 | 28.13 | 28.13 | 28.13 | 28.13 |
| Inventories | 1,344.6 | 1,195.7 | 1,765.1 | 1,233.2 | 984.2 | 1,202.9 | 1,339.5 | 1,491.7 | 1,661.2 | 1,849.9 |
| Inventories, % | 9.6 | 8.12 | 5.74 | 5.71 | 6.5 | 7.14 | 7.14 | 7.14 | 7.14 | 7.14 |
| Accounts Payable | 2,079.7 | 1,685.4 | 2,026.3 | 2,277.7 | 1,857.1 | 1,878.2 | 2,091.6 | 2,329.2 | 2,593.8 | 2,888.4 |
| Accounts Payable, % | 14.85 | 11.45 | 6.59 | 10.56 | 12.27 | 11.14 | 11.14 | 11.14 | 11.14 | 11.14 |
| Capital Expenditure | -537.1 | -808.3 | -680.1 | -943.0 | -1,221.8 | -808.4 | -900.2 | -1,002.5 | -1,116.4 | -1,243.2 |
| Capital Expenditure, % | -3.84 | -5.49 | -2.21 | -4.37 | -8.07 | -4.8 | -4.8 | -4.8 | -4.8 | -4.8 |
| Tax Rate, % | 19 | 19 | 19 | 19 | 19 | 19 | 19 | 19 | 19 | 19 |
| EBITAT | 2,585.9 | 5,016.7 | 15,647.6 | 7,361.2 | 4,328.4 | 5,561.5 | 6,193.3 | 6,896.8 | 7,680.3 | 8,552.8 |
| Depreciation | ||||||||||
| Changes in Account Receivables | ||||||||||
| Changes in Inventories | ||||||||||
| Changes in Accounts Payable | ||||||||||
| Capital Expenditure | ||||||||||
| UFCF | 185.9 | 3,977.4 | 11,216.1 | 8,819.4 | 6,363.6 | 5,169.6 | 5,598.1 | 6,234.1 | 6,942.3 | 7,730.9 |
| WACC, % | 10.86 | 10.88 | 10.87 | 10.87 | 10.88 | 10.87 | 10.87 | 10.87 | 10.87 | 10.87 |
| PV UFCF | ||||||||||
| SUM PV UFCF | 22,999.4 | |||||||||
| Long Term Growth Rate, % | 0.50 | |||||||||
| Free cash flow (T + 1) | 7,770 | |||||||||
| Terminal Value | 74,907 | |||||||||
| Present Terminal Value | 44,710 | |||||||||
| Enterprise Value | 67,710 | |||||||||
| Net Debt | -15,322 | |||||||||
| Equity Value | 83,031 | |||||||||
| Diluted Shares Outstanding, MM | 5,292 | |||||||||
| Equity Value Per Share | 15.69 |
What You Will Receive
- Customizable Excel Template: A versatile Excel-based DCF Calculator featuring pre-filled financial data for Qinghai Salt Lake Industry Co., Ltd (000792SZ).
- Comprehensive Data: Access to historical performance metrics and future projections (highlighted in the yellow cells).
- Adjustable Forecast Assumptions: Modify key inputs such as revenue growth rates, EBITDA percentages, and WACC.
- Instant Calculations: Instantly observe how your adjustments affect the valuation of Qinghai Salt Lake Industry Co., Ltd (000792SZ).
- Professional Resource: Designed specifically for investors, CFOs, consultants, and financial analysts.
- Intuitive Interface: Organized for ease of understanding and usability, complete with step-by-step guidance.
Key Features
- Genuine Financial Data: Access precise pre-loaded historical figures and future forecasts for Qinghai Salt Lake Industry Co., Ltd (000792SZ).
- Adjustable Forecast Parameters: Modify the highlighted cells for critical metrics such as WACC, growth rates, and profit margins.
- Real-Time Calculations: Automatic updates for DCF, Net Present Value (NPV), and cash flow assessments.
- User-Friendly Dashboard: Intuitive charts and summaries to help you easily interpret your valuation outcomes.
- Designed for All Skill Levels: A straightforward, user-friendly layout suitable for investors, CFOs, and consultants alike.
Process Overview
- 1. Access the Template: Download and open the Excel file containing preloaded data for Qinghai Salt Lake Industry Co., Ltd (000792SZ).
- 2. Adjust Assumptions: Modify essential inputs such as growth projections, weighted average cost of capital (WACC), and capital expenditures.
- 3. Analyze Immediate Results: The DCF model automatically computes intrinsic value and net present value (NPV) in real-time.
- 4. Explore Various Scenarios: Evaluate multiple forecasts to understand different valuation possibilities.
- 5. Present with Assurance: Deliver professional valuation analyses to enhance your decision-making process.
Why Opt for the Qinghai Salt Lake Industry Calculator?
- Time Efficient: Skip the hassle of building a DCF model from the ground up – it’s ready for immediate use.
- Enhanced Precision: Dependable financial data and formulas minimize valuation errors.
- Completely Customizable: Adjust the model to fit your specific assumptions and forecasts.
- Simple to Understand: Intuitive charts and outputs allow for easy interpretation of results.
- Endorsed by Professionals: Crafted for experts who prioritize accuracy and ease of use.
Who Can Benefit from This Product?
- Professional Investors: Develop comprehensive and accurate valuation models for portfolio assessment of Qinghai Salt Lake Industry Co., Ltd (000792SZ).
- Corporate Finance Teams: Evaluate various valuation scenarios to inform strategic decisions within the organization.
- Consultants and Advisors: Deliver precise valuation insights to clients regarding Qinghai Salt Lake Industry Co., Ltd (000792SZ).
- Students and Educators: Utilize real-world data for practicing and teaching financial modeling techniques.
- Industry Enthusiasts: Gain insights into the valuation processes of companies like Qinghai Salt Lake Industry Co., Ltd (000792SZ).
Contents of the Template
- Pre-Filled DCF Model: Financial data for Qinghai Salt Lake Industry Co., Ltd (000792SZ) preloaded for immediate utilization.
- WACC Calculator: Comprehensive calculations for the Weighted Average Cost of Capital.
- Financial Ratios: Assess Qinghai Salt Lake Industry Co., Ltd (000792SZ)'s profitability, leverage, and efficiency.
- Editable Inputs: Modify assumptions such as growth rates, margins, and capital expenditures to suit your scenarios.
- Financial Statements: Access to annual and quarterly reports for in-depth analysis.
- Interactive Dashboard: Effortlessly visualize essential valuation metrics and results.
Disclaimer
All information, articles, and product details provided on this website are for general informational and educational purposes only. We do not claim any ownership over, nor do we intend to infringe upon, any trademarks, copyrights, logos, brand names, or other intellectual property mentioned or depicted on this site. Such intellectual property remains the property of its respective owners, and any references here are made solely for identification or informational purposes, without implying any affiliation, endorsement, or partnership.
We make no representations or warranties, express or implied, regarding the accuracy, completeness, or suitability of any content or products presented. Nothing on this website should be construed as legal, tax, investment, financial, medical, or other professional advice. In addition, no part of this site—including articles or product references—constitutes a solicitation, recommendation, endorsement, advertisement, or offer to buy or sell any securities, franchises, or other financial instruments, particularly in jurisdictions where such activity would be unlawful.
All content is of a general nature and may not address the specific circumstances of any individual or entity. It is not a substitute for professional advice or services. Any actions you take based on the information provided here are strictly at your own risk. You accept full responsibility for any decisions or outcomes arising from your use of this website and agree to release us from any liability in connection with your use of, or reliance upon, the content or products found herein.