
|
C.Q. Pharmaceutical Holding Co., Ltd. (000950.sz) Avaliação DCF |
Totalmente Editável: Adapte-Se Às Suas Necessidades No Excel Ou Planilhas
Design Profissional: Modelos Confiáveis E Padrão Da Indústria
Pré-Construídos Para Uso Rápido E Eficiente
Compatível com MAC/PC, totalmente desbloqueado
Não É Necessária Experiência; Fácil De Seguir
C.Q. Pharmaceutical Holding Co., Ltd. (000950.SZ) Bundle
Descubra o verdadeiro valor de C.q. A Pharmaceutical Holding Co., Ltd. (000950SZ) com nossa calculadora DCF avançada! Ajuste as suposições críticas, explore vários cenários e avalie como as mudanças influenciam C.Q. A Avaliação da Pharmaceutical Holding Co., Ltd. (000950SZ) - tudo dentro de um único modelo do Excel.
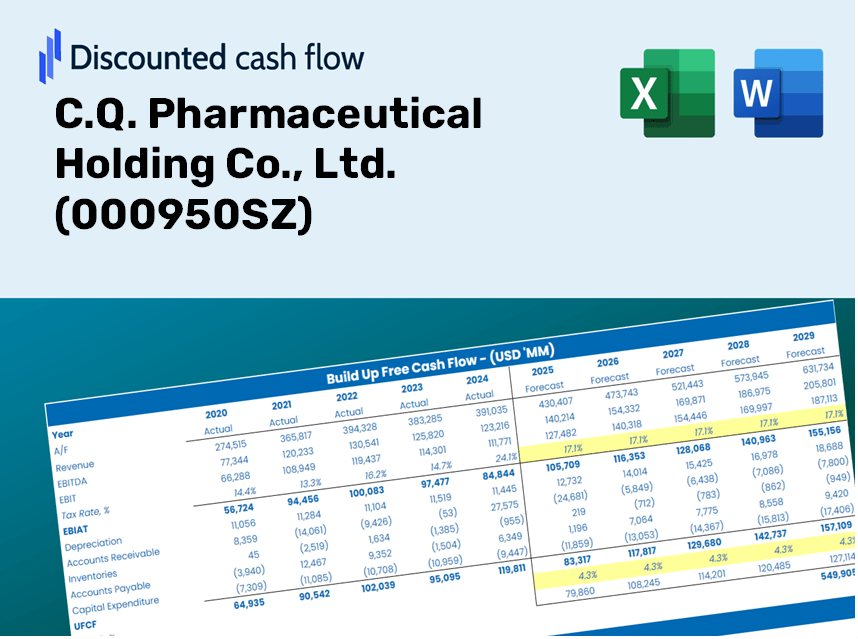
Discounted Cash Flow (DCF) - (USD MM)
| Year | AY1 2020 |
AY2 2021 |
AY3 2022 |
AY4 2023 |
AY5 2024 |
FY1 2025 |
FY2 2026 |
FY3 2027 |
FY4 2028 |
FY5 2029 |
|---|---|---|---|---|---|---|---|---|---|---|
| Revenue | 45,219.6 | 62,520.8 | 67,829.0 | 80,119.1 | 80,561.5 | 93,737.8 | 109,069.2 | 126,908.0 | 147,664.5 | 171,815.9 |
| Revenue Growth, % | 0 | 38.26 | 8.49 | 18.12 | 0.55221 | 16.36 | 16.36 | 16.36 | 16.36 | 16.36 |
| EBITDA | 2,174.7 | 2,998.5 | 2,999.8 | 2,748.6 | 2,161.1 | 3,776.0 | 4,393.5 | 5,112.1 | 5,948.2 | 6,921.1 |
| EBITDA, % | 4.81 | 4.8 | 4.42 | 3.43 | 2.68 | 4.03 | 4.03 | 4.03 | 4.03 | 4.03 |
| Depreciation | 157.2 | 358.9 | 437.1 | 396.8 | 465.7 | 494.8 | 575.7 | 669.9 | 779.5 | 907.0 |
| Depreciation, % | 0.34762 | 0.57397 | 0.64437 | 0.49527 | 0.57809 | 0.52786 | 0.52786 | 0.52786 | 0.52786 | 0.52786 |
| EBIT | 2,017.5 | 2,639.7 | 2,562.7 | 2,351.8 | 1,695.3 | 3,281.1 | 3,817.8 | 4,442.2 | 5,168.8 | 6,014.1 |
| EBIT, % | 4.46 | 4.22 | 3.78 | 2.94 | 2.1 | 3.5 | 3.5 | 3.5 | 3.5 | 3.5 |
| Total Cash | 4,692.5 | 5,677.1 | 7,429.1 | 9,148.8 | 9,391.5 | 10,027.4 | 11,667.5 | 13,575.8 | 15,796.2 | 18,379.7 |
| Total Cash, percent | .0 | .0 | .0 | .0 | .0 | .0 | .0 | .0 | .0 | .0 |
| Account Receivables | 23,448.3 | 27,848.4 | 30,751.2 | 35,882.3 | 36,082.7 | 43,364.7 | 50,457.3 | 58,709.8 | 68,312.1 | 79,485.0 |
| Account Receivables, % | 51.85 | 44.54 | 45.34 | 44.79 | 44.79 | 46.26 | 46.26 | 46.26 | 46.26 | 46.26 |
| Inventories | 5,652.7 | 6,050.8 | 7,862.5 | 7,924.6 | 9,977.4 | 10,507.3 | 12,225.9 | 14,225.5 | 16,552.1 | 19,259.3 |
| Inventories, % | 12.5 | 9.68 | 11.59 | 9.89 | 12.38 | 11.21 | 11.21 | 11.21 | 11.21 | 11.21 |
| Accounts Payable | 10,974.1 | 12,126.0 | 7,897.7 | 17,437.2 | 18,165.0 | 18,676.2 | 21,730.8 | 25,285.0 | 29,420.5 | 34,232.4 |
| Accounts Payable, % | 24.27 | 19.4 | 11.64 | 21.76 | 22.55 | 19.92 | 19.92 | 19.92 | 19.92 | 19.92 |
| Capital Expenditure | -378.2 | -489.5 | -268.1 | -244.4 | -250.5 | -493.2 | -573.8 | -667.7 | -776.9 | -903.9 |
| Capital Expenditure, % | -0.83628 | -0.78302 | -0.39521 | -0.30505 | -0.31098 | -0.52611 | -0.52611 | -0.52611 | -0.52611 | -0.52611 |
| Tax Rate, % | 49.24 | 49.24 | 49.24 | 49.24 | 49.24 | 49.24 | 49.24 | 49.24 | 49.24 | 49.24 |
| EBITAT | 1,298.1 | 1,679.5 | 1,657.3 | 1,527.3 | 860.6 | 2,023.4 | 2,354.3 | 2,739.4 | 3,187.4 | 3,708.8 |
| Depreciation | ||||||||||
| Changes in Account Receivables | ||||||||||
| Changes in Inventories | ||||||||||
| Changes in Accounts Payable | ||||||||||
| Capital Expenditure | ||||||||||
| UFCF | -17,049.8 | -2,097.5 | -7,116.5 | 6,025.9 | -449.6 | -5,275.7 | -3,400.2 | -3,956.3 | -4,603.4 | -5,356.3 |
| WACC, % | 3.95 | 3.93 | 3.97 | 3.98 | 3.44 | 3.85 | 3.85 | 3.85 | 3.85 | 3.85 |
| PV UFCF | ||||||||||
| SUM PV UFCF | -20,156.4 | |||||||||
| Long Term Growth Rate, % | 3.00 | |||||||||
| Free cash flow (T + 1) | -5,517 | |||||||||
| Terminal Value | -647,615 | |||||||||
| Present Terminal Value | -536,098 | |||||||||
| Enterprise Value | -556,255 | |||||||||
| Net Debt | 11,467 | |||||||||
| Equity Value | -567,722 | |||||||||
| Diluted Shares Outstanding, MM | 1,769 | |||||||||
| Equity Value Per Share | -320.98 |
What You Will Gain
- Adjustable Forecast Parameters: Effortlessly modify key assumptions (growth %, margins, WACC) to explore various scenarios.
- Comprehensive Data: C.Q. Pharmaceutical Holding Co., Ltd. (000950SZ) financial data pre-loaded to facilitate your analysis.
- Automatic DCF Calculations: The template computes Net Present Value (NPV) and intrinsic value automatically.
- Tailored and Professional Design: A sleek Excel model that can be customized to meet your valuation requirements.
- Designed for Analysts and Investors: Perfect for evaluating projections, confirming strategies, and optimizing efficiency.
Key Features
- Pre-Loaded Data: Historical financial statements and pre-filled forecasts for C.Q. Pharmaceutical Holding Co., Ltd. (000950SZ).
- Fully Adjustable Inputs: Customize WACC, tax rates, revenue growth, and EBITDA margins to fit your analysis.
- Instant Results: Witness the intrinsic value of C.Q. Pharmaceutical Holding Co., Ltd. (000950SZ) update in real time.
- Clear Visual Outputs: Dashboard charts provide a visual representation of valuation results and key metrics.
- Built for Accuracy: A professional-grade tool designed for analysts, investors, and finance professionals.
How It Works
- Download the Template: Gain immediate access to the Excel-based C.Q. Pharmaceutical DCF Calculator.
- Input Your Assumptions: Modify the yellow-highlighted cells for growth rates, WACC, margins, and other key metrics.
- Instant Calculations: The model automatically recalculates the intrinsic value of C.Q. Pharmaceutical (000950SZ).
- Test Scenarios: Explore different assumptions to assess potential changes in valuation.
- Analyze and Decide: Utilize the findings to inform your investment or financial evaluation.
Why Opt for This Calculator?
- User-Friendly: Tailored for both novices and seasoned professionals.
- Customizable Inputs: Easily adjust parameters to suit your analysis needs.
- Real-Time Updates: Observe immediate shifts in C.Q. Pharmaceutical's valuation as you change inputs.
- Preconfigured Data: Comes equipped with C.Q. Pharmaceutical's actual financial information for swift evaluations.
- Relied Upon by Experts: Favored by investors and analysts for making well-informed decisions.
Who Can Benefit from This Product?
- Investors: Evaluate C.Q. Pharmaceutical Holding Co., Ltd.'s (000950SZ) valuation before making buy or sell decisions.
- CFOs and Financial Analysts: Optimize valuation workflows and assess financial projections.
- Startup Founders: Understand the valuation methodologies applied to leading public companies like C.Q. Pharmaceutical Holding Co., Ltd. (000950SZ).
- Consultants: Provide detailed valuation reports tailored for your clients.
- Students and Educators: Utilize real-life data to practice and teach effective valuation strategies.
What the Template Includes
- Detailed DCF Model: An editable template featuring comprehensive valuation calculations.
- Real-World Data: C.Q. Pharmaceutical Holding Co., Ltd.'s (000950SZ) historical and projected financials preloaded for analysis.
- Customizable Variables: Modify WACC, growth rates, and tax assumptions to explore different scenarios.
- Financial Statements: Complete annual and quarterly financial breakdowns for enhanced insights.
- Key Financial Ratios: Integrated analysis for profitability, efficiency, and leverage metrics.
- Dashboard with Visual Outputs: Graphs and tables providing clear and actionable insights.
Disclaimer
All information, articles, and product details provided on this website are for general informational and educational purposes only. We do not claim any ownership over, nor do we intend to infringe upon, any trademarks, copyrights, logos, brand names, or other intellectual property mentioned or depicted on this site. Such intellectual property remains the property of its respective owners, and any references here are made solely for identification or informational purposes, without implying any affiliation, endorsement, or partnership.
We make no representations or warranties, express or implied, regarding the accuracy, completeness, or suitability of any content or products presented. Nothing on this website should be construed as legal, tax, investment, financial, medical, or other professional advice. In addition, no part of this site—including articles or product references—constitutes a solicitation, recommendation, endorsement, advertisement, or offer to buy or sell any securities, franchises, or other financial instruments, particularly in jurisdictions where such activity would be unlawful.
All content is of a general nature and may not address the specific circumstances of any individual or entity. It is not a substitute for professional advice or services. Any actions you take based on the information provided here are strictly at your own risk. You accept full responsibility for any decisions or outcomes arising from your use of this website and agree to release us from any liability in connection with your use of, or reliance upon, the content or products found herein.