
|
Tecnologia avançada & Materiais Co., Ltd. (000969.SZ) Avaliação DCF |
Totalmente Editável: Adapte-Se Às Suas Necessidades No Excel Ou Planilhas
Design Profissional: Modelos Confiáveis E Padrão Da Indústria
Pré-Construídos Para Uso Rápido E Eficiente
Compatível com MAC/PC, totalmente desbloqueado
Não É Necessária Experiência; Fácil De Seguir
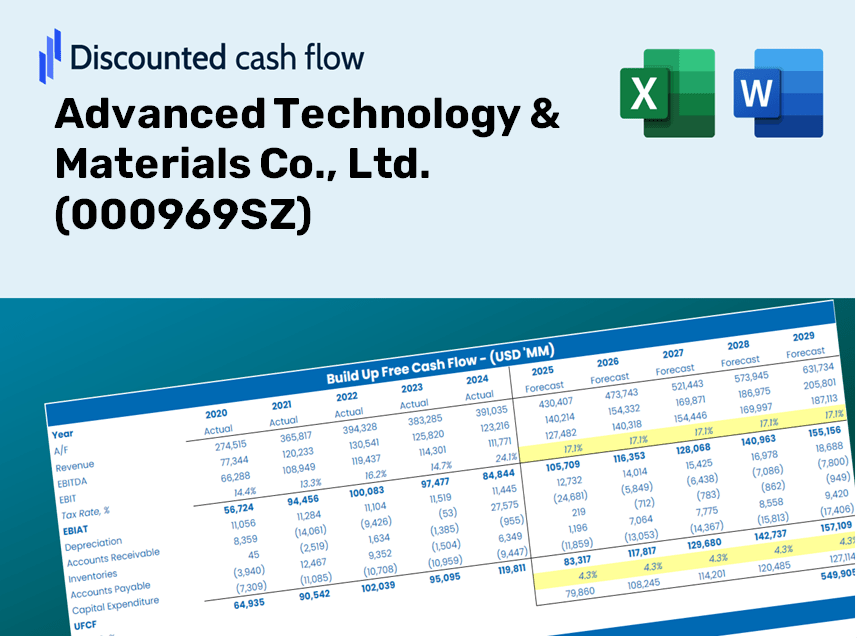
Advanced Technology & Materials Co., Ltd. (000969.SZ) Bundle
Explore o futuro financeiro da tecnologia avançada & Materiais Co., Ltd. (000969SZ) com nossa calculadora DCF amigável! Digite suas suposições de crescimento, margens e custos para calcular o valor intrínseco da tecnologia avançada & Materiais Co., Ltd. (000969SZ) e refine sua abordagem de investimento.
Benefits You Will Receive
- Genuine Data for Advanced Technology & Materials: Comprehensive financial insights – from revenue figures to EBIT – grounded in actual and forecasted data.
- Complete Customization Options: Modify all essential parameters (highlighted fields) such as WACC, growth percentages, and tax rates.
- Real-Time Valuation Adjustments: Automatic updates to evaluate the effects of any changes on the fair value of Advanced Technology & Materials (000969SZ).
- User-Friendly Excel Template: Designed for effortless modifications, scenario analysis, and detailed projections.
- Efficient and Precise: Eliminate the need to create models from the ground up while ensuring accuracy and adaptability.
Key Features
- 🔍 Real-Life 000969SZ Financials: Pre-filled historical and projected data for Advanced Technology & Materials Co., Ltd.
- ✏️ Fully Customizable Inputs: Modify all essential parameters (yellow cells) such as WACC, growth %, and tax rates.
- 📊 Professional DCF Valuation: Integrated formulas compute the intrinsic value of Advanced Technology & Materials using the Discounted Cash Flow method.
- ⚡ Instant Results: Visualize the company's valuation immediately after adjustments are made.
- Scenario Analysis: Evaluate and compare outcomes for different financial assumptions side-by-side.
How It Works
- Step 1: Download the Excel file tailored for Advanced Technology & Materials Co., Ltd. (000969SZ).
- Step 2: Review the pre-filled financial data and forecasts for Advanced Technology & Materials Co., Ltd. (000969SZ).
- Step 3: Adjust key inputs such as revenue growth, WACC, and tax rates (highlighted cells).
- Step 4: Observe the DCF model update in real-time as you modify your assumptions.
- Step 5: Analyze the outputs to inform your investment decisions regarding Advanced Technology & Materials Co., Ltd. (000969SZ).
Why Choose This Calculator for Advanced Technology & Materials Co., Ltd. (000969SZ)?
- User-Friendly Interface: Perfectly crafted for both novices and experienced users.
- Customizable Inputs: Adjust parameters easily to suit your analytical needs.
- Real-Time Valuation Updates: Observe immediate changes in Advanced Technology & Materials Co., Ltd. (000969SZ)'s valuation as you modify inputs.
- Pre-Loaded Financial Data: Comes equipped with the latest financial figures for fast and efficient analysis.
- Relied Upon by Experts: A preferred tool for investors and analysts to make well-informed choices.
Who Can Benefit from This Product?
- Investors: Assess the valuation of Advanced Technology & Materials Co., Ltd. (000969SZ) before making investment decisions.
- CFOs and Financial Analysts: Enhance valuation methodologies and evaluate financial forecasts.
- Startup Founders: Discover how large public firms like Advanced Technology & Materials Co., Ltd. (000969SZ) are appraised.
- Consultants: Provide expert valuation assessments and reports for clients.
- Students and Educators: Utilize real market data to practice and teach valuation strategies effectively.
Contents of the Template
- Operating and Balance Sheet Data: Pre-loaded historical data and forecasts for Advanced Technology & Materials Co., Ltd. (000969SZ), including revenue, EBITDA, EBIT, and capital expenditures.
- WACC Calculation: A dedicated worksheet for calculating the Weighted Average Cost of Capital (WACC), featuring parameters such as Beta, risk-free rate, and share price.
- DCF Valuation (Unlevered and Levered): Customizable Discounted Cash Flow models that reveal intrinsic value along with comprehensive calculations.
- Financial Statements: Pre-filled annual and quarterly financial statements to facilitate thorough analysis.
- Key Ratios: Includes key profitability, leverage, and efficiency ratios for Advanced Technology & Materials Co., Ltd. (000969SZ).
- Dashboard and Charts: Visual representation of valuation results and underlying assumptions for easy analysis.
Disclaimer
All information, articles, and product details provided on this website are for general informational and educational purposes only. We do not claim any ownership over, nor do we intend to infringe upon, any trademarks, copyrights, logos, brand names, or other intellectual property mentioned or depicted on this site. Such intellectual property remains the property of its respective owners, and any references here are made solely for identification or informational purposes, without implying any affiliation, endorsement, or partnership.
We make no representations or warranties, express or implied, regarding the accuracy, completeness, or suitability of any content or products presented. Nothing on this website should be construed as legal, tax, investment, financial, medical, or other professional advice. In addition, no part of this site—including articles or product references—constitutes a solicitation, recommendation, endorsement, advertisement, or offer to buy or sell any securities, franchises, or other financial instruments, particularly in jurisdictions where such activity would be unlawful.
All content is of a general nature and may not address the specific circumstances of any individual or entity. It is not a substitute for professional advice or services. Any actions you take based on the information provided here are strictly at your own risk. You accept full responsibility for any decisions or outcomes arising from your use of this website and agree to release us from any liability in connection with your use of, or reliance upon, the content or products found herein.