
|
Interior Mongolia Dazhong Mining Co., Ltd. (001203.sz) Avaliação DCF |
Totalmente Editável: Adapte-Se Às Suas Necessidades No Excel Ou Planilhas
Design Profissional: Modelos Confiáveis E Padrão Da Indústria
Pré-Construídos Para Uso Rápido E Eficiente
Compatível com MAC/PC, totalmente desbloqueado
Não É Necessária Experiência; Fácil De Seguir
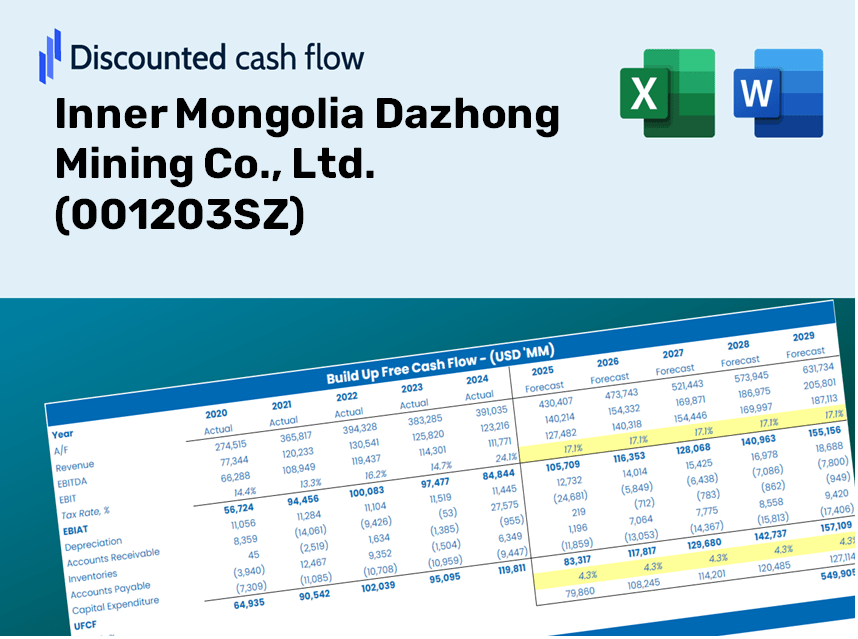
Inner Mongolia Dazhong Mining Co., Ltd. (001203.SZ) Bundle
Obtenha uma visão da sua análise de avaliação da Mongoólia Dazhong Co., Ltd. (001203SZ) com a nossa calculadora DCF de última geração! Este modelo do Excel é pré -carregado com dados reais (001203SZ), permitindo que você ajuste as previsões e suposições para um cálculo preciso do valor intrínseco da Mongolia Dazhong Co., Ltd., Ltd..
Discounted Cash Flow (DCF) - (USD MM)
| Year | AY1 2020 |
AY2 2021 |
AY3 2022 |
AY4 2023 |
AY5 2024 |
FY1 2025 |
FY2 2026 |
FY3 2027 |
FY4 2028 |
FY5 2029 |
|---|---|---|---|---|---|---|---|---|---|---|
| Revenue | 2,496.8 | 4,894.9 | 4,157.2 | 4,003.5 | 3,842.8 | 4,546.7 | 5,379.5 | 6,364.8 | 7,530.7 | 8,910.1 |
| Revenue Growth, % | 0 | 96.05 | -15.07 | -3.7 | -4.01 | 18.32 | 18.32 | 18.32 | 18.32 | 18.32 |
| EBITDA | 1,160.6 | 2,375.6 | 1,614.1 | 1,857.1 | 1,656.0 | 2,030.8 | 2,402.8 | 2,842.9 | 3,363.6 | 3,979.7 |
| EBITDA, % | 46.49 | 48.53 | 38.83 | 46.39 | 43.09 | 44.67 | 44.67 | 44.67 | 44.67 | 44.67 |
| Depreciation | 229.5 | 308.4 | 360.0 | 433.5 | 497.3 | 435.8 | 515.6 | 610.1 | 721.8 | 854.0 |
| Depreciation, % | 9.19 | 6.3 | 8.66 | 10.83 | 12.94 | 9.59 | 9.59 | 9.59 | 9.59 | 9.59 |
| EBIT | 931.1 | 2,067.2 | 1,254.1 | 1,423.6 | 1,158.6 | 1,595.0 | 1,887.1 | 2,232.8 | 2,641.8 | 3,125.7 |
| EBIT, % | 37.29 | 42.23 | 30.17 | 35.56 | 30.15 | 35.08 | 35.08 | 35.08 | 35.08 | 35.08 |
| Total Cash | 279.9 | 1,037.9 | 2,826.4 | 324.7 | 648.5 | 1,140.2 | 1,349.1 | 1,596.2 | 1,888.6 | 2,234.5 |
| Total Cash, percent | .0 | .0 | .0 | .0 | .0 | .0 | .0 | .0 | .0 | .0 |
| Account Receivables | 372.6 | 247.9 | 369.0 | 417.9 | 224.7 | 410.5 | 485.7 | 574.7 | 680.0 | 804.5 |
| Account Receivables, % | 14.92 | 5.06 | 8.88 | 10.44 | 5.85 | 9.03 | 9.03 | 9.03 | 9.03 | 9.03 |
| Inventories | 165.8 | 377.1 | 568.6 | 494.7 | 708.3 | 534.8 | 632.7 | 748.6 | 885.7 | 1,048.0 |
| Inventories, % | 6.64 | 7.7 | 13.68 | 12.36 | 18.43 | 11.76 | 11.76 | 11.76 | 11.76 | 11.76 |
| Accounts Payable | 433.6 | 369.5 | 459.2 | 532.5 | 774.7 | 631.3 | 746.9 | 883.7 | 1,045.6 | 1,237.1 |
| Accounts Payable, % | 17.37 | 7.55 | 11.05 | 13.3 | 20.16 | 13.88 | 13.88 | 13.88 | 13.88 | 13.88 |
| Capital Expenditure | -272.8 | -364.3 | -853.2 | -5,032.0 | -1,224.7 | -1,552.8 | -1,837.2 | -2,173.8 | -2,571.9 | -3,043.0 |
| Capital Expenditure, % | -10.93 | -7.44 | -20.52 | -125.69 | -31.87 | -34.15 | -34.15 | -34.15 | -34.15 | -34.15 |
| Tax Rate, % | 17.77 | 17.77 | 17.77 | 17.77 | 17.77 | 17.77 | 17.77 | 17.77 | 17.77 | 17.77 |
| EBITAT | 801.1 | 1,758.1 | 1,094.6 | 1,235.3 | 952.7 | 1,363.3 | 1,613.0 | 1,908.4 | 2,258.0 | 2,671.6 |
| Depreciation | ||||||||||
| Changes in Account Receivables | ||||||||||
| Changes in Inventories | ||||||||||
| Changes in Accounts Payable | ||||||||||
| Capital Expenditure | ||||||||||
| UFCF | 653.0 | 1,551.5 | 378.5 | -3,264.8 | 447.1 | 90.5 | 233.8 | 276.7 | 327.4 | 387.3 |
| WACC, % | 7.23 | 7.22 | 7.25 | 7.24 | 7.19 | 7.23 | 7.23 | 7.23 | 7.23 | 7.23 |
| PV UFCF | ||||||||||
| SUM PV UFCF | 1,033.0 | |||||||||
| Long Term Growth Rate, % | 2.00 | |||||||||
| Free cash flow (T + 1) | 395 | |||||||||
| Terminal Value | 7,557 | |||||||||
| Present Terminal Value | 5,331 | |||||||||
| Enterprise Value | 6,365 | |||||||||
| Net Debt | 4,656 | |||||||||
| Equity Value | 1,709 | |||||||||
| Diluted Shares Outstanding, MM | 1,473 | |||||||||
| Equity Value Per Share | 1.16 |
Benefits You'll Receive
- Customizable Excel Template: A fully editable Excel-based DCF Calculator featuring pre-populated financial data for Inner Mongolia Dazhong Mining Co., Ltd. (001203SZ).
- Comprehensive Data: Access to historical performance metrics and forward-looking projections (highlighted in the yellow cells).
- Adjustable Forecasts: Tailor key assumptions such as revenue growth, EBITDA margins, and WACC to suit your analysis.
- Instant Calculations: Quickly observe how your inputs influence the valuation of Inner Mongolia Dazhong Mining Co., Ltd. (001203SZ).
- Professional Resource: Designed for investors, CFOs, consultants, and financial analysts.
- User-Centric Design: Organized for straightforward navigation and usability, complete with detailed guidance.
Key Features
- Authentic Financial Data: Gain access to precise pre-loaded historical figures and future forecasts for Inner Mongolia Dazhong Mining Co., Ltd. (001203SZ).
- Personalizable Projection Inputs: Modify highlighted cells for variables such as WACC, growth rates, and profit margins.
- Real-Time Calculations: Enjoy automatic updates for DCF, Net Present Value (NPV), and cash flow assessments.
- User-Friendly Dashboard: View your valuation outcomes through clear charts and summaries.
- Suitable for All Skill Levels: Designed with an intuitive layout for investors, CFOs, and consultants alike.
How It Works
- Step 1: Download the prebuilt Excel template featuring Inner Mongolia Dazhong Mining Co., Ltd.'s (001203SZ) data.
- Step 2: Navigate through the filled-out sheets to familiarize yourself with the essential metrics.
- Step 3: Modify forecasts and assumptions in the editable yellow cells (WACC, growth, margins).
- Step 4: Instantly view updated results, including the intrinsic value of Inner Mongolia Dazhong Mining Co., Ltd. (001203SZ).
- Step 5: Utilize the insights to make informed investment choices or create reports based on the outputs.
Why Choose This Calculator for Inner Mongolia Dazhong Mining Co., Ltd. (001203SZ)?
- User-Friendly Interface: Tailored for both novice and seasoned users.
- Customizable Parameters: Adjust inputs effortlessly to suit your financial analysis.
- Real-Time Updates: Instantly view changes to Inner Mongolia Dazhong's valuation as you tweak the data.
- Preloaded Data: Comes equipped with actual financial metrics for Inner Mongolia Dazhong for swift assessments.
- Endorsed by Experts: Preferred by investors and analysts for making well-informed choices.
Who Can Benefit from This Product?
- Investors: Evaluate the valuation of Inner Mongolia Dazhong Mining Co., Ltd. (001203SZ) before making stock trades.
- CFOs and Financial Analysts: Optimize valuation procedures and assess forecasts related to (001203SZ).
- Startup Founders: Understand the valuation methodologies applied to major mining companies like Inner Mongolia Dazhong Mining Co., Ltd. (001203SZ).
- Consultants: Produce comprehensive valuation reports tailored for clients interested in (001203SZ).
- Students and Educators: Utilize real-world examples from (001203SZ) to enhance learning and practice valuation principles.
Contents of the Template
- Preloaded Dazhong Mining Data: Historical and projected financial metrics, including revenue, EBIT, and capital expenditures.
- DCF and WACC Models: Advanced templates for calculating intrinsic value and Weighted Average Cost of Capital (WACC).
- Editable Inputs: Yellow-highlighted fields for customizing revenue growth rates, tax rates, and discount rates.
- Financial Statements: Detailed annual and quarterly financial documents for in-depth analysis.
- Key Ratios: Profitability, leverage, and efficiency ratios to assess financial performance.
- Dashboard and Charts: Visual representations of valuation results and underlying assumptions.
Company: Inner Mongolia Dazhong Mining Co., Ltd. (001203SZ)
Disclaimer
All information, articles, and product details provided on this website are for general informational and educational purposes only. We do not claim any ownership over, nor do we intend to infringe upon, any trademarks, copyrights, logos, brand names, or other intellectual property mentioned or depicted on this site. Such intellectual property remains the property of its respective owners, and any references here are made solely for identification or informational purposes, without implying any affiliation, endorsement, or partnership.
We make no representations or warranties, express or implied, regarding the accuracy, completeness, or suitability of any content or products presented. Nothing on this website should be construed as legal, tax, investment, financial, medical, or other professional advice. In addition, no part of this site—including articles or product references—constitutes a solicitation, recommendation, endorsement, advertisement, or offer to buy or sell any securities, franchises, or other financial instruments, particularly in jurisdictions where such activity would be unlawful.
All content is of a general nature and may not address the specific circumstances of any individual or entity. It is not a substitute for professional advice or services. Any actions you take based on the information provided here are strictly at your own risk. You accept full responsibility for any decisions or outcomes arising from your use of this website and agree to release us from any liability in connection with your use of, or reliance upon, the content or products found herein.