
|
Shenzhen KTC Technology Co., Ltd. (001308.sz) DCF Avaliação |
Totalmente Editável: Adapte-Se Às Suas Necessidades No Excel Ou Planilhas
Design Profissional: Modelos Confiáveis E Padrão Da Indústria
Pré-Construídos Para Uso Rápido E Eficiente
Compatível com MAC/PC, totalmente desbloqueado
Não É Necessária Experiência; Fácil De Seguir
Shenzhen KTC Technology Co., Ltd. (001308.SZ) Bundle
Explore o potencial financeiro da Shenzhen KTC Technology Co., Ltd. (001308SZ) com nossa calculadora DCF amigável! Digite suas projeções de crescimento, margens de lucro e despesas para determinar o valor intrínseco da Shenzhen KTC Technology Co., Ltd. (001308SZ) e apoie suas decisões de investimento.
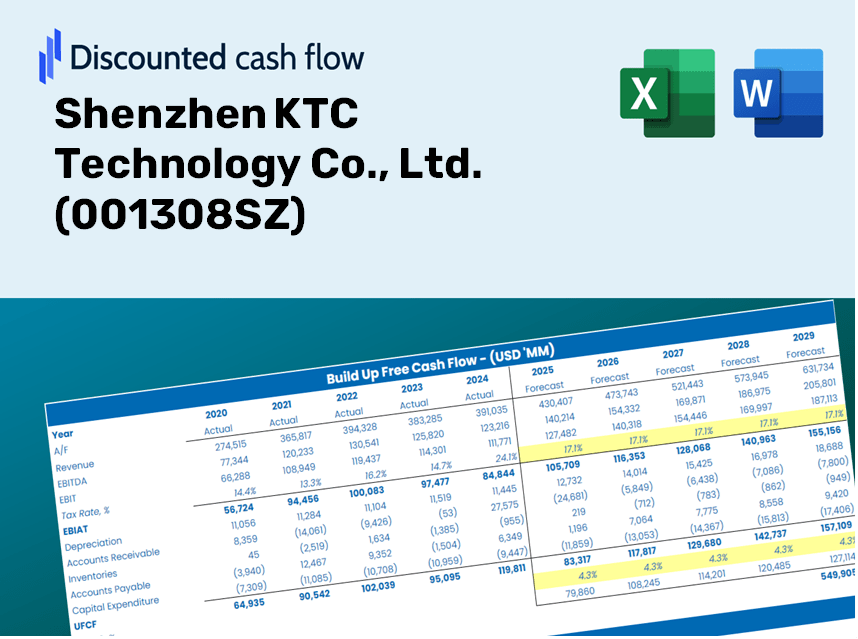
Discounted Cash Flow (DCF) - (USD MM)
| Year | AY1 2020 |
AY2 2021 |
AY3 2022 |
AY4 2023 |
AY5 2024 |
FY1 2025 |
FY2 2026 |
FY3 2027 |
FY4 2028 |
FY5 2029 |
|---|---|---|---|---|---|---|---|---|---|---|
| Revenue | 7,413.6 | 11,888.7 | 11,587.0 | 13,446.7 | 15,587.0 | 19,085.9 | 23,370.4 | 28,616.6 | 35,040.4 | 42,906.3 |
| Revenue Growth, % | 0 | 60.36 | -2.54 | 16.05 | 15.92 | 22.45 | 22.45 | 22.45 | 22.45 | 22.45 |
| EBITDA | 586.4 | 1,041.0 | 1,406.6 | 1,226.3 | 683.6 | 1,615.1 | 1,977.6 | 2,421.5 | 2,965.1 | 3,630.7 |
| EBITDA, % | 7.91 | 8.76 | 12.14 | 9.12 | 4.39 | 8.46 | 8.46 | 8.46 | 8.46 | 8.46 |
| Depreciation | 49.8 | 64.8 | 72.7 | 85.6 | 88.1 | 116.3 | 142.4 | 174.3 | 213.5 | 261.4 |
| Depreciation, % | 0.67182 | 0.54544 | 0.62743 | 0.63661 | 0.56498 | 0.60925 | 0.60925 | 0.60925 | 0.60925 | 0.60925 |
| EBIT | 536.6 | 976.1 | 1,333.9 | 1,140.7 | 595.5 | 1,498.8 | 1,835.2 | 2,247.2 | 2,751.6 | 3,369.3 |
| EBIT, % | 7.24 | 8.21 | 11.51 | 8.48 | 3.82 | 7.85 | 7.85 | 7.85 | 7.85 | 7.85 |
| Total Cash | 873.8 | 960.8 | 3,829.7 | 3,315.0 | 4,725.5 | 4,118.4 | 5,042.8 | 6,174.9 | 7,561.0 | 9,258.3 |
| Total Cash, percent | .0 | .0 | .0 | .0 | .0 | .0 | .0 | .0 | .0 | .0 |
| Account Receivables | 1,222.0 | 1,845.0 | 2,153.3 | 4,083.2 | 3,710.6 | 3,998.8 | 4,896.4 | 5,995.6 | 7,341.5 | 8,989.5 |
| Account Receivables, % | 16.48 | 15.52 | 18.58 | 30.37 | 23.81 | 20.95 | 20.95 | 20.95 | 20.95 | 20.95 |
| Inventories | 1,659.8 | 1,657.5 | 2,163.9 | 2,340.3 | 3,251.9 | 3,560.4 | 4,359.6 | 5,338.3 | 6,536.6 | 8,004.0 |
| Inventories, % | 22.39 | 13.94 | 18.67 | 17.4 | 20.86 | 18.65 | 18.65 | 18.65 | 18.65 | 18.65 |
| Accounts Payable | 1,540.9 | 1,898.9 | 1,806.2 | 2,588.2 | 2,403.7 | 3,321.5 | 4,067.2 | 4,980.2 | 6,098.1 | 7,467.0 |
| Accounts Payable, % | 20.79 | 15.97 | 15.59 | 19.25 | 15.42 | 17.4 | 17.4 | 17.4 | 17.4 | 17.4 |
| Capital Expenditure | -119.4 | -127.3 | -239.2 | -205.8 | -244.0 | -299.4 | -366.6 | -448.9 | -549.7 | -673.0 |
| Capital Expenditure, % | -1.61 | -1.07 | -2.06 | -1.53 | -1.57 | -1.57 | -1.57 | -1.57 | -1.57 | -1.57 |
| Tax Rate, % | 1.8 | 1.8 | 1.8 | 1.8 | 1.8 | 1.8 | 1.8 | 1.8 | 1.8 | 1.8 |
| EBITAT | 503.2 | 921.5 | 1,218.6 | 1,151.1 | 584.8 | 1,432.0 | 1,753.5 | 2,147.1 | 2,629.1 | 3,219.3 |
| Depreciation | ||||||||||
| Changes in Account Receivables | ||||||||||
| Changes in Inventories | ||||||||||
| Changes in Accounts Payable | ||||||||||
| Capital Expenditure | ||||||||||
| UFCF | -907.3 | 596.3 | 144.7 | -293.5 | -294.5 | 1,570.0 | 578.0 | 707.8 | 866.6 | 1,061.2 |
| WACC, % | 4.64 | 4.64 | 4.61 | 4.7 | 4.68 | 4.65 | 4.65 | 4.65 | 4.65 | 4.65 |
| PV UFCF | ||||||||||
| SUM PV UFCF | 4,213.1 | |||||||||
| Long Term Growth Rate, % | 2.00 | |||||||||
| Free cash flow (T + 1) | 1,082 | |||||||||
| Terminal Value | 40,781 | |||||||||
| Present Terminal Value | 32,485 | |||||||||
| Enterprise Value | 36,698 | |||||||||
| Net Debt | 1,894 | |||||||||
| Equity Value | 34,804 | |||||||||
| Diluted Shares Outstanding, MM | 699 | |||||||||
| Equity Value Per Share | 49.81 |
What You Will Receive
- Authentic 001308SZ Financial Data: Pre-populated with Shenzhen KTC Technology’s historical and forecasted data for accurate analysis.
- Completely Customizable Template: Effortlessly adjust critical inputs such as revenue growth, WACC, and EBITDA %.
- Instant Calculations: Watch the intrinsic value of Shenzhen KTC Technology update immediately based on your modifications.
- Expert Valuation Tool: Tailored for investors, analysts, and consultants aiming for precise DCF outcomes.
- Intuitive Interface: Straightforward layout and clear guidance suitable for users of all skill levels.
Key Features
- Comprehensive Data: Historical financial statements and pre-filled forecasts for Shenzhen KTC Technology Co., Ltd. (001308SZ).
- Customizable Inputs: Modify WACC, tax rates, revenue growth, and EBITDA margins as needed.
- Real-Time Analysis: Observe the recalculation of Shenzhen KTC Technology Co., Ltd.'s (001308SZ) intrinsic value instantly.
- Visual Performance Metrics: Dashboard charts present valuation results and crucial key metrics clearly.
- Designed for Precision: A reliable tool tailored for analysts, investors, and financial professionals.
How It Works
- Step 1: Download the Excel file for Shenzhen KTC Technology Co., Ltd. (001308SZ).
- Step 2: Review the pre-filled financial data and forecasts specific to Shenzhen KTC Technology Co., Ltd. (001308SZ).
- Step 3: Adjust key inputs such as revenue growth, WACC, and tax rates (cells marked for modification).
- Step 4: Observe the DCF model refresh in real-time as you make changes to the assumptions.
- Step 5: Examine the results and leverage the insights for your investment strategies.
Why Opt for This Calculator?
- All-in-One Solution: Features DCF, WACC, and comprehensive financial ratio analyses all in a single tool.
- Flexible Inputs: Modify the yellow-highlighted cells to explore different scenarios effortlessly.
- In-Depth Analysis: Automatically computes Shenzhen KTC Technology Co., Ltd.’s intrinsic value and Net Present Value.
- Preloaded Information: Historical and projected data provides reliable starting points for your calculations.
- Professional Standard: Perfect for financial analysts, investors, and business consultants seeking precision.
Who Can Benefit from This Product?
- Investors: Evaluate Shenzhen KTC Technology Co., Ltd.'s (001308SZ) market valuation prior to making stock transactions.
- CFOs and Financial Analysts: Enhance valuation workflows and validate financial forecasts.
- Startup Founders: Gain insights into how prominent companies like Shenzhen KTC Technology Co., Ltd. are appraised.
- Consultants: Create comprehensive valuation reports for your clientele.
- Students and Educators: Utilize actual market data for practicing and teaching valuation methodologies.
Contents of the Template
- Comprehensive DCF Model: An editable template featuring thorough valuation calculations.
- Real-World Data: Historical and projected financials for Shenzhen KTC Technology Co., Ltd. (001308SZ) included for analysis.
- Customizable Parameters: Modify WACC, growth rates, and tax assumptions to explore various scenarios.
- Financial Statements: Comprehensive annual and quarterly breakdowns for enhanced insights.
- Key Ratios: In-depth analysis of profitability, efficiency, and leverage.
- Dashboard with Visual Outputs: Interactive charts and tables providing clear and actionable results.
Disclaimer
All information, articles, and product details provided on this website are for general informational and educational purposes only. We do not claim any ownership over, nor do we intend to infringe upon, any trademarks, copyrights, logos, brand names, or other intellectual property mentioned or depicted on this site. Such intellectual property remains the property of its respective owners, and any references here are made solely for identification or informational purposes, without implying any affiliation, endorsement, or partnership.
We make no representations or warranties, express or implied, regarding the accuracy, completeness, or suitability of any content or products presented. Nothing on this website should be construed as legal, tax, investment, financial, medical, or other professional advice. In addition, no part of this site—including articles or product references—constitutes a solicitation, recommendation, endorsement, advertisement, or offer to buy or sell any securities, franchises, or other financial instruments, particularly in jurisdictions where such activity would be unlawful.
All content is of a general nature and may not address the specific circumstances of any individual or entity. It is not a substitute for professional advice or services. Any actions you take based on the information provided here are strictly at your own risk. You accept full responsibility for any decisions or outcomes arising from your use of this website and agree to release us from any liability in connection with your use of, or reliance upon, the content or products found herein.