
|
Henan Yuneng Holdings Co., Ltd. (001896.sz) Avaliação do DCF |
Totalmente Editável: Adapte-Se Às Suas Necessidades No Excel Ou Planilhas
Design Profissional: Modelos Confiáveis E Padrão Da Indústria
Pré-Construídos Para Uso Rápido E Eficiente
Compatível com MAC/PC, totalmente desbloqueado
Não É Necessária Experiência; Fácil De Seguir
Henan Yuneng Holdings Co.,Ltd. (001896.SZ) Bundle
Descubra o verdadeiro potencial da Henan Yuneng Holdings Co., Ltd. (001896SZ) com nossa calculadora DCF avançada! Ajuste as suposições essenciais, explore vários cenários e avalie como as alterações afetam a avaliação da Henan Yuneng Holdings Co., Ltd. (001896SZ) - tudo convenientemente embalado em um único modelo do Excel.
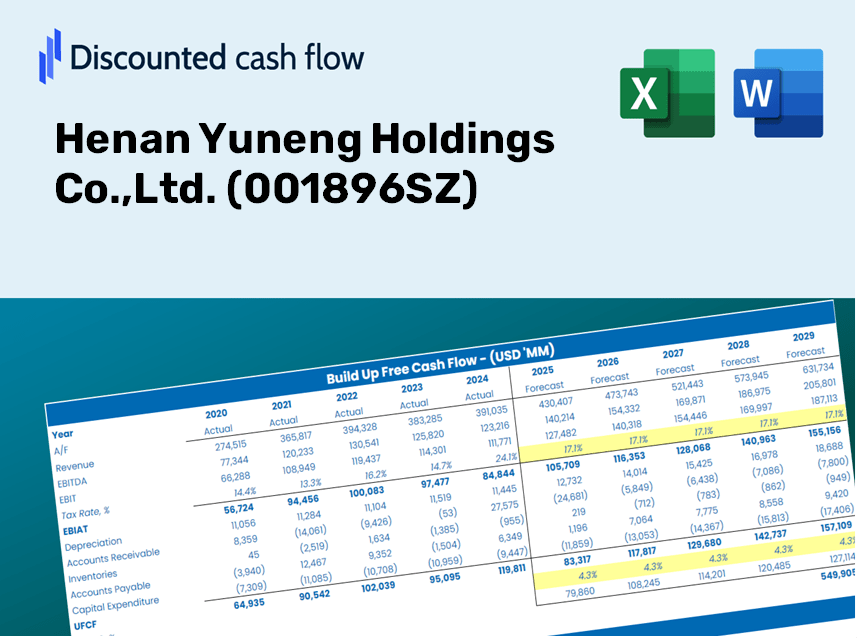
Discounted Cash Flow (DCF) - (USD MM)
| Year | AY1 2020 |
AY2 2021 |
AY3 2022 |
AY4 2023 |
AY5 2024 |
FY1 2025 |
FY2 2026 |
FY3 2027 |
FY4 2028 |
FY5 2029 |
|---|---|---|---|---|---|---|---|---|---|---|
| Revenue | 8,680.9 | 11,940.6 | 13,097.5 | 11,984.5 | 12,155.5 | 13,376.1 | 14,719.4 | 16,197.5 | 17,824.0 | 19,613.9 |
| Revenue Growth, % | 0 | 37.55 | 9.69 | -8.5 | 1.43 | 10.04 | 10.04 | 10.04 | 10.04 | 10.04 |
| EBITDA | 1,817.6 | -571.0 | -432.4 | 1,471.8 | 1,893.7 | 1,089.2 | 1,198.6 | 1,318.9 | 1,451.4 | 1,597.1 |
| EBITDA, % | 20.94 | -4.78 | -3.3 | 12.28 | 15.58 | 8.14 | 8.14 | 8.14 | 8.14 | 8.14 |
| Depreciation | 901.3 | 1,243.0 | 1,351.0 | 1,379.1 | 1,365.9 | 1,440.6 | 1,585.3 | 1,744.5 | 1,919.7 | 2,112.5 |
| Depreciation, % | 10.38 | 10.41 | 10.31 | 11.51 | 11.24 | 10.77 | 10.77 | 10.77 | 10.77 | 10.77 |
| EBIT | 916.3 | -1,814.0 | -1,783.4 | 92.7 | 527.8 | -351.5 | -386.8 | -425.6 | -468.3 | -515.4 |
| EBIT, % | 10.56 | -15.19 | -13.62 | 0.77319 | 4.34 | -2.63 | -2.63 | -2.63 | -2.63 | -2.63 |
| Total Cash | 1,178.4 | 1,846.1 | 3,061.3 | 1,291.3 | 1,350.2 | 1,987.4 | 2,187.0 | 2,406.6 | 2,648.3 | 2,914.3 |
| Total Cash, percent | .0 | .0 | .0 | .0 | .0 | .0 | .0 | .0 | .0 | .0 |
| Account Receivables | 2,365.6 | 1,991.6 | 1,944.3 | 2,818.9 | 2,023.8 | 2,647.0 | 2,912.8 | 3,205.3 | 3,527.2 | 3,881.4 |
| Account Receivables, % | 27.25 | 16.68 | 14.84 | 23.52 | 16.65 | 19.79 | 19.79 | 19.79 | 19.79 | 19.79 |
| Inventories | 549.9 | 1,377.0 | 1,174.8 | 794.0 | 1,002.2 | 1,115.7 | 1,227.8 | 1,351.1 | 1,486.8 | 1,636.1 |
| Inventories, % | 6.34 | 11.53 | 8.97 | 6.63 | 8.24 | 8.34 | 8.34 | 8.34 | 8.34 | 8.34 |
| Accounts Payable | 1,593.1 | 3,726.8 | 3,822.3 | 1,407.6 | 2,084.8 | 2,879.7 | 3,168.9 | 3,487.1 | 3,837.2 | 4,222.6 |
| Accounts Payable, % | 18.35 | 31.21 | 29.18 | 11.74 | 17.15 | 21.53 | 21.53 | 21.53 | 21.53 | 21.53 |
| Capital Expenditure | -1,334.7 | -1,527.7 | -1,899.6 | -2,112.0 | -2,151.4 | -2,086.5 | -2,296.1 | -2,526.6 | -2,780.4 | -3,059.6 |
| Capital Expenditure, % | -15.38 | -12.79 | -14.5 | -17.62 | -17.7 | -15.6 | -15.6 | -15.6 | -15.6 | -15.6 |
| Tax Rate, % | -869.15 | -869.15 | -869.15 | -869.15 | -869.15 | -869.15 | -869.15 | -869.15 | -869.15 | -869.15 |
| EBITAT | 797.7 | -1,464.6 | -1,440.1 | 88.4 | 5,115.1 | -312.0 | -343.4 | -377.8 | -415.8 | -457.5 |
| Depreciation | ||||||||||
| Changes in Account Receivables | ||||||||||
| Changes in Inventories | ||||||||||
| Changes in Accounts Payable | ||||||||||
| Capital Expenditure | ||||||||||
| UFCF | -958.1 | -68.8 | -1,643.6 | -3,553.1 | 5,593.8 | -899.9 | -1,142.8 | -1,257.6 | -1,383.8 | -1,522.8 |
| WACC, % | 5.16 | 4.98 | 4.98 | 5.39 | 5.52 | 5.2 | 5.2 | 5.2 | 5.2 | 5.2 |
| PV UFCF | ||||||||||
| SUM PV UFCF | -5,279.3 | |||||||||
| Long Term Growth Rate, % | 4.00 | |||||||||
| Free cash flow (T + 1) | -1,584 | |||||||||
| Terminal Value | -131,591 | |||||||||
| Present Terminal Value | -102,112 | |||||||||
| Enterprise Value | -107,391 | |||||||||
| Net Debt | 17,243 | |||||||||
| Equity Value | -124,634 | |||||||||
| Diluted Shares Outstanding, MM | 1,525 | |||||||||
| Equity Value Per Share | -81.72 |
What You Will Receive
- Pre-Loaded Financial Model: Utilize Henan Yuneng Holdings Co., Ltd.'s actual data for accurate DCF valuation.
- Comprehensive Forecast Control: Modify revenue growth, profit margins, WACC, and other vital metrics.
- Real-Time Calculations: Instant updates allow you to view results immediately as you adjust inputs.
- Professional-Grade Template: A polished Excel spreadsheet specifically crafted for high-quality valuation.
- Flexible and Reusable: Designed for adaptability, enabling repeated application for thorough forecasts.
Key Features
- Comprehensive Historical Data: Pre-loaded with Henan Yuneng Holdings Co., Ltd.'s (001896SZ) past financial performance and future projections.
- Customizable Input Options: Tailor variables such as revenue growth, profit margins, WACC, tax rates, and capital expenditures to suit your analysis.
- Interactive Valuation Model: Real-time updates to Net Present Value (NPV) and intrinsic value based on your customized parameters.
- Flexible Scenario Analysis: Develop various forecasting scenarios to evaluate different valuation possibilities.
- Intuitive User Interface: Designed to be accessible and straightforward for both novice and seasoned users.
How It Works
- Step 1: Download the Excel file for Henan Yuneng Holdings Co.,Ltd. (001896SZ).
- Step 2: Examine the pre-filled financial data and projections for Henan Yuneng Holdings.
- Step 3: Adjust key inputs such as revenue growth, WACC, and tax rates (highlighted cells).
- Step 4: Observe the DCF model update in real-time as you modify your assumptions.
- Step 5: Evaluate the outputs and leverage the findings for your investment strategies.
Why Opt for This Calculator?
- All-in-One Solution: Combines DCF, WACC, and financial ratio analyses tailored for Henan Yuneng Holdings Co.,Ltd. (001896SZ).
- Flexible Inputs: Easily modify the yellow-highlighted fields to explore various financial scenarios.
- In-Depth Analysis: Automatically computes the intrinsic value and Net Present Value for Henan Yuneng Holdings Co.,Ltd. (001896SZ).
- Ready-to-Use Data: Features historical and projected data for a solid analytical foundation.
- Expert-Level Quality: Perfect for financial analysts, investors, and business consultants focused on Henan Yuneng Holdings Co.,Ltd. (001896SZ).
Who Should Use This Product?
- Individual Investors: Gain insights to make informed decisions regarding buying or selling shares of Henan Yuneng Holdings Co.,Ltd. (001896SZ).
- Financial Analysts: Enhance valuation processes with readily available financial models tailored for Henan Yuneng Holdings Co.,Ltd. (001896SZ).
- Consultants: Provide clients with timely and precise valuation insights on Henan Yuneng Holdings Co.,Ltd. (001896SZ).
- Business Owners: Learn how large corporations like Henan Yuneng Holdings Co.,Ltd. (001896SZ) are valued to inform your own business strategies.
- Finance Students: Develop valuation skills using real-world data and practical examples from Henan Yuneng Holdings Co.,Ltd. (001896SZ).
Contents of the Template
- Pre-Filled Data: Features Henan Yuneng Holdings Co., Ltd.'s historical financials and projections.
- Discounted Cash Flow Model: An editable DCF valuation model with automated calculations.
- Weighted Average Cost of Capital (WACC): A dedicated sheet for WACC calculations based on user-defined inputs.
- Key Financial Ratios: Assess Henan Yuneng's profitability, operational efficiency, and financial leverage.
- Customizable Inputs: Easily modify revenue growth rates, profit margins, and tax rates.
- Clear Dashboard: Visual summaries with charts and tables highlighting key valuation outcomes.
Disclaimer
All information, articles, and product details provided on this website are for general informational and educational purposes only. We do not claim any ownership over, nor do we intend to infringe upon, any trademarks, copyrights, logos, brand names, or other intellectual property mentioned or depicted on this site. Such intellectual property remains the property of its respective owners, and any references here are made solely for identification or informational purposes, without implying any affiliation, endorsement, or partnership.
We make no representations or warranties, express or implied, regarding the accuracy, completeness, or suitability of any content or products presented. Nothing on this website should be construed as legal, tax, investment, financial, medical, or other professional advice. In addition, no part of this site—including articles or product references—constitutes a solicitation, recommendation, endorsement, advertisement, or offer to buy or sell any securities, franchises, or other financial instruments, particularly in jurisdictions where such activity would be unlawful.
All content is of a general nature and may not address the specific circumstances of any individual or entity. It is not a substitute for professional advice or services. Any actions you take based on the information provided here are strictly at your own risk. You accept full responsibility for any decisions or outcomes arising from your use of this website and agree to release us from any liability in connection with your use of, or reliance upon, the content or products found herein.