
|
Operação de propriedade dos comerciantes da China & Service Co., Ltd. (001914.sz) Avaliação DCF |
Totalmente Editável: Adapte-Se Às Suas Necessidades No Excel Ou Planilhas
Design Profissional: Modelos Confiáveis E Padrão Da Indústria
Pré-Construídos Para Uso Rápido E Eficiente
Compatível com MAC/PC, totalmente desbloqueado
Não É Necessária Experiência; Fácil De Seguir
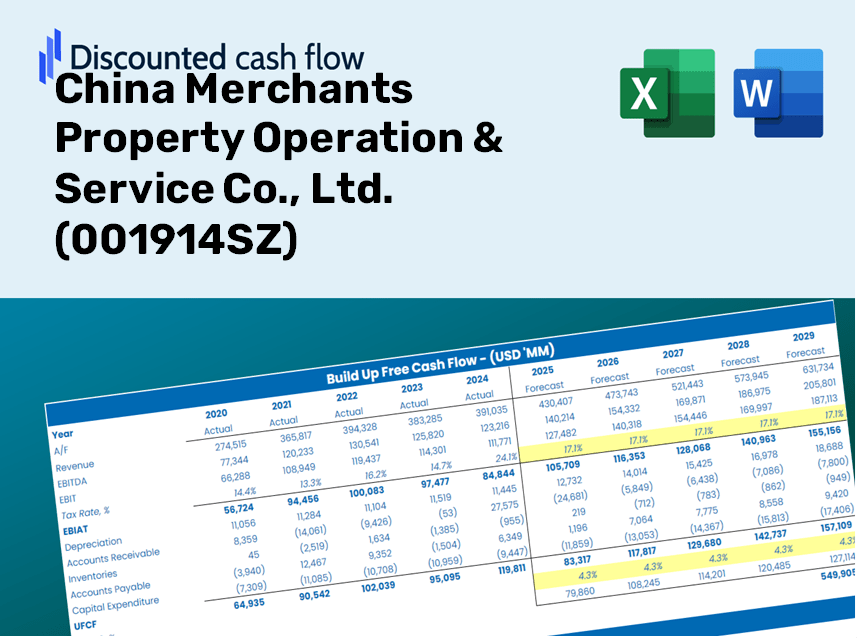
China Merchants Property Operation & Service Co., Ltd. (001914.SZ) Bundle
Simplificar a operação de propriedade dos comerciantes da China & Service Co., Ltd. (001914SZ) Avaliação com esta calculadora DCF personalizável! Apresentando a operação de propriedade dos comerciantes da China Real & Service Co., Ltd. (001914SZ) Financeiras e insumos de previsão ajustáveis, você pode testar cenários e descobrir a operação de propriedade dos comerciantes da China & Service Co., Ltd. (001914SZ) Valor justo em minutos.
Discounted Cash Flow (DCF) - (USD MM)
| Year | AY1 2020 |
AY2 2021 |
AY3 2022 |
AY4 2023 |
AY5 2024 |
FY1 2025 |
FY2 2026 |
FY3 2027 |
FY4 2028 |
FY5 2029 |
|---|---|---|---|---|---|---|---|---|---|---|
| Revenue | 8,651.2 | 10,590.9 | 13,023.8 | 15,626.7 | 17,172.3 | 16,140.3 | 15,170.4 | 14,258.7 | 13,401.8 | 12,596.4 |
| Revenue Growth, % | 0 | 22.42 | 22.97 | 19.99 | 9.89 | -6.01 | -6.01 | -6.01 | -6.01 | -6.01 |
| EBITDA | 754.8 | 804.3 | 871.7 | 998.1 | 1,174.1 | 1,169.8 | 1,099.5 | 1,033.4 | 971.3 | 912.9 |
| EBITDA, % | 8.73 | 7.59 | 6.69 | 6.39 | 6.84 | 7.25 | 7.25 | 7.25 | 7.25 | 7.25 |
| Depreciation | 35.5 | 36.4 | 46.1 | 55.9 | 42.9 | 55.4 | 52.1 | 48.9 | 46.0 | 43.2 |
| Depreciation, % | 0.41071 | 0.3437 | 0.35406 | 0.35759 | 0.25001 | 0.34321 | 0.34321 | 0.34321 | 0.34321 | 0.34321 |
| EBIT | 719.3 | 767.9 | 825.6 | 942.3 | 1,131.2 | 1,114.4 | 1,047.4 | 984.5 | 925.3 | 869.7 |
| EBIT, % | 8.31 | 7.25 | 6.34 | 6.03 | 6.59 | 6.9 | 6.9 | 6.9 | 6.9 | 6.9 |
| Total Cash | 2,301.9 | 2,060.4 | 3,167.1 | 4,347.6 | 4,668.8 | 4,047.7 | 3,804.5 | 3,575.8 | 3,360.9 | 3,159.0 |
| Total Cash, percent | .0 | .0 | .0 | .0 | .0 | .0 | .0 | .0 | .0 | .0 |
| Account Receivables | 1,657.4 | 2,192.6 | 3,283.4 | 2,318.7 | 3,212.8 | 3,183.5 | 2,992.1 | 2,812.3 | 2,643.3 | 2,484.5 |
| Account Receivables, % | 19.16 | 20.7 | 25.21 | 14.84 | 18.71 | 19.72 | 19.72 | 19.72 | 19.72 | 19.72 |
| Inventories | 1,574.7 | 1,390.0 | 1,164.4 | 1,116.7 | 1,145.7 | 1,745.9 | 1,641.0 | 1,542.4 | 1,449.7 | 1,362.6 |
| Inventories, % | 18.2 | 13.12 | 8.94 | 7.15 | 6.67 | 10.82 | 10.82 | 10.82 | 10.82 | 10.82 |
| Accounts Payable | 775.0 | 1,040.6 | 1,703.7 | 2,155.1 | 2,974.1 | 2,032.9 | 1,910.7 | 1,795.9 | 1,688.0 | 1,586.5 |
| Accounts Payable, % | 8.96 | 9.83 | 13.08 | 13.79 | 17.32 | 12.6 | 12.6 | 12.6 | 12.6 | 12.6 |
| Capital Expenditure | -35.2 | -18.6 | -28.2 | -30.6 | -23.8 | -36.6 | -34.4 | -32.3 | -30.4 | -28.6 |
| Capital Expenditure, % | -0.40709 | -0.17545 | -0.21654 | -0.19564 | -0.13871 | -0.22668 | -0.22668 | -0.22668 | -0.22668 | -0.22668 |
| Tax Rate, % | 26.19 | 26.19 | 26.19 | 26.19 | 26.19 | 26.19 | 26.19 | 26.19 | 26.19 | 26.19 |
| EBITAT | 500.3 | 527.7 | 596.4 | 746.7 | 834.9 | 810.3 | 761.6 | 715.8 | 672.8 | 632.4 |
| Depreciation | ||||||||||
| Changes in Account Receivables | ||||||||||
| Changes in Inventories | ||||||||||
| Changes in Accounts Payable | ||||||||||
| Capital Expenditure | ||||||||||
| UFCF | -1,956.6 | 460.7 | 412.2 | 2,235.9 | 749.8 | -682.9 | 953.3 | 896.0 | 842.2 | 791.6 |
| WACC, % | 6.48 | 6.48 | 6.5 | 6.53 | 6.51 | 6.5 | 6.5 | 6.5 | 6.5 | 6.5 |
| PV UFCF | ||||||||||
| SUM PV UFCF | 2,173.4 | |||||||||
| Long Term Growth Rate, % | 3.50 | |||||||||
| Free cash flow (T + 1) | 819 | |||||||||
| Terminal Value | 27,305 | |||||||||
| Present Terminal Value | 19,929 | |||||||||
| Enterprise Value | 22,102 | |||||||||
| Net Debt | -3,773 | |||||||||
| Equity Value | 25,875 | |||||||||
| Diluted Shares Outstanding, MM | 1,060 | |||||||||
| Equity Value Per Share | 24.40 |
What You Will Receive
- Authentic Financial Data: Comprehensive financials – from revenue to EBIT – based on actual and projected figures for China Merchants Property Operation & Service Co., Ltd. (001914SZ).
- Complete Customization: Modify all essential parameters (highlighted cells) such as WACC, growth %, and tax rates.
- Real-Time Valuation Adjustments: Automatic recalculations to evaluate the influence of changes on the fair value of China Merchants Property Operation & Service Co., Ltd. (001914SZ).
- Flexible Excel Template: Designed for seamless edits, scenario analysis, and in-depth projections.
- Efficient and Precise: Avoid the hassle of creating models from scratch while ensuring accuracy and adaptability.
Key Features
- 🔍 Real-Life CMP Financials: Pre-filled historical and projected data for China Merchants Property Operation & Service Co., Ltd. (001914SZ).
- ✏️ Fully Customizable Inputs: Adjust all essential parameters (yellow cells) such as WACC, growth %, and tax rates.
- 📊 Professional DCF Valuation: Integrated formulas calculate the intrinsic value of CMP using the Discounted Cash Flow method.
- ⚡ Instant Results: Visualize CMP’s valuation instantly after modifying inputs.
- Scenario Analysis: Evaluate and compare different outcomes based on various financial assumptions side-by-side.
How It Operates
- Download: Obtain the pre-formatted Excel file containing financial data for China Merchants Property Operation & Service Co., Ltd. (001914SZ).
- Customize: Modify key forecasts, such as revenue growth, EBITDA percentage, and WACC.
- Update Automatically: Watch as the intrinsic value and NPV calculations refresh in real-time.
- Test Scenarios: Generate various projections and evaluate the outcomes instantly.
- Make Decisions: Leverage the valuation results to refine your investment approach.
Why Choose This Calculator for China Merchants Property Operation & Service Co., Ltd. (001914SZ)?
- User-Friendly Interface: Perfectly crafted for both novice users and seasoned professionals.
- Customizable Inputs: Easily adjust parameters to suit your analytical needs.
- Real-Time Valuation: Watch as the valuation for China Merchants Property updates instantly with each input change.
- Pre-Configured Data: Comes with China Merchants Property’s actual financial information for immediate analysis.
- Relied Upon by Experts: Widely utilized by investors and analysts for making well-informed investment choices.
Who Can Benefit from This Product?
- Investors: Evaluate the intrinsic value of China Merchants Property Operation & Service Co., Ltd. (001914SZ) before making investment choices.
- CFOs: Utilize a high-quality DCF model for financial analysis and reporting.
- Consultants: Easily modify the template for client valuation reports.
- Entrepreneurs: Discover financial modeling strategies employed by top-tier real estate firms.
- Educators: Employ it as a resource for teaching valuation techniques.
Contents of the Template
- Comprehensive DCF Model: Editable template featuring detailed valuation calculations tailored for China Merchants Property Operation & Service Co., Ltd. (001914SZ).
- Real-World Data: Historical and projected financial data for China Merchants Property preloaded for in-depth analysis.
- Customizable Parameters: Modify WACC, growth rates, and tax assumptions to explore various scenarios.
- Financial Statements: Complete annual and quarterly breakdowns to provide deeper insights into financial performance.
- Key Ratios: Integrated analysis focusing on profitability, efficiency, and leverage metrics.
- Dashboard with Visual Outputs: Charts and tables designed for clear, actionable insights.
Disclaimer
All information, articles, and product details provided on this website are for general informational and educational purposes only. We do not claim any ownership over, nor do we intend to infringe upon, any trademarks, copyrights, logos, brand names, or other intellectual property mentioned or depicted on this site. Such intellectual property remains the property of its respective owners, and any references here are made solely for identification or informational purposes, without implying any affiliation, endorsement, or partnership.
We make no representations or warranties, express or implied, regarding the accuracy, completeness, or suitability of any content or products presented. Nothing on this website should be construed as legal, tax, investment, financial, medical, or other professional advice. In addition, no part of this site—including articles or product references—constitutes a solicitation, recommendation, endorsement, advertisement, or offer to buy or sell any securities, franchises, or other financial instruments, particularly in jurisdictions where such activity would be unlawful.
All content is of a general nature and may not address the specific circumstances of any individual or entity. It is not a substitute for professional advice or services. Any actions you take based on the information provided here are strictly at your own risk. You accept full responsibility for any decisions or outcomes arising from your use of this website and agree to release us from any liability in connection with your use of, or reliance upon, the content or products found herein.