
|
Huapont Life Sciences Co., Ltd. (002004.sz) Avaliação DCF |
Totalmente Editável: Adapte-Se Às Suas Necessidades No Excel Ou Planilhas
Design Profissional: Modelos Confiáveis E Padrão Da Indústria
Pré-Construídos Para Uso Rápido E Eficiente
Compatível com MAC/PC, totalmente desbloqueado
Não É Necessária Experiência; Fácil De Seguir
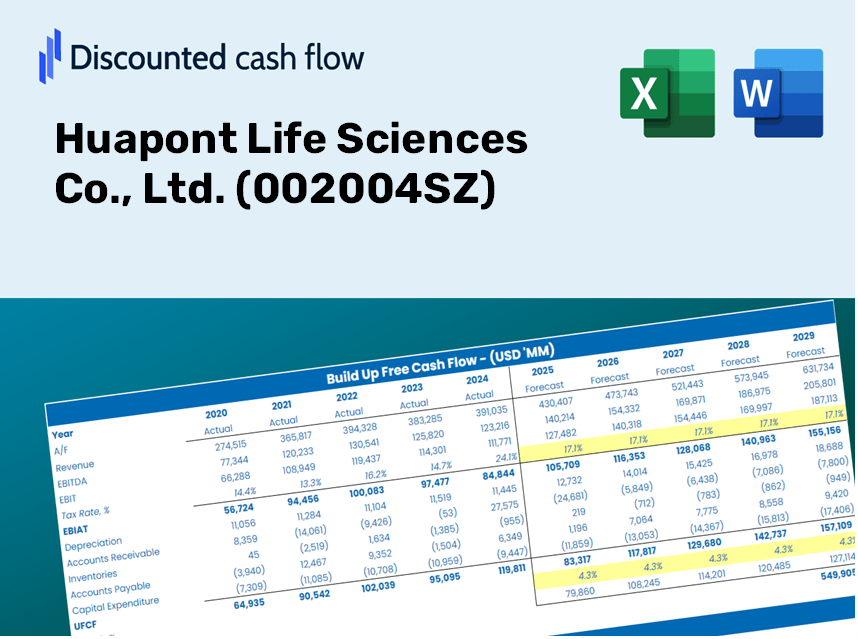
Huapont Life Sciences Co., Ltd. (002004.SZ) Bundle
Seja você um investidor ou analista, esta calculadora DCF (002004SZ) é o seu recurso preferido para uma avaliação precisa. Carregado com dados reais da Huapont Life Sciences Co., Ltd., você pode ajustar as previsões e observar instantaneamente os resultados.
Discounted Cash Flow (DCF) - (USD MM)
| Year | AY1 2020 |
AY2 2021 |
AY3 2022 |
AY4 2023 |
AY5 2024 |
FY1 2025 |
FY2 2026 |
FY3 2027 |
FY4 2028 |
FY5 2029 |
|---|---|---|---|---|---|---|---|---|---|---|
| Revenue | 10,876.4 | 12,431.1 | 13,232.4 | 11,594.6 | 11,664.7 | 11,926.2 | 12,193.6 | 12,466.9 | 12,746.4 | 13,032.2 |
| Revenue Growth, % | 0 | 14.29 | 6.45 | -12.38 | 0.60441 | 2.24 | 2.24 | 2.24 | 2.24 | 2.24 |
| EBITDA | 2,174.6 | 2,200.5 | 2,646.6 | 2,164.8 | 1,995.1 | 2,229.5 | 2,279.5 | 2,330.6 | 2,382.8 | 2,436.3 |
| EBITDA, % | 19.99 | 17.7 | 20 | 18.67 | 17.1 | 18.69 | 18.69 | 18.69 | 18.69 | 18.69 |
| Depreciation | 696.3 | 716.4 | 771.1 | 858.2 | 926.8 | 795.2 | 813.1 | 831.3 | 849.9 | 869.0 |
| Depreciation, % | 6.4 | 5.76 | 5.83 | 7.4 | 7.95 | 6.67 | 6.67 | 6.67 | 6.67 | 6.67 |
| EBIT | 1,478.3 | 1,484.1 | 1,875.5 | 1,306.6 | 1,068.3 | 1,434.3 | 1,466.4 | 1,499.3 | 1,532.9 | 1,567.3 |
| EBIT, % | 13.59 | 11.94 | 14.17 | 11.27 | 9.16 | 12.03 | 12.03 | 12.03 | 12.03 | 12.03 |
| Total Cash | 4,984.7 | 5,416.6 | 4,892.9 | 5,610.3 | 3,943.6 | 4,975.0 | 5,086.5 | 5,200.6 | 5,317.2 | 5,436.4 |
| Total Cash, percent | .0 | .0 | .0 | .0 | .0 | .0 | .0 | .0 | .0 | .0 |
| Account Receivables | 2,196.0 | 2,675.9 | 2,293.5 | 2,047.5 | 3,133.4 | 2,470.4 | 2,525.8 | 2,582.4 | 2,640.3 | 2,699.5 |
| Account Receivables, % | 20.19 | 21.53 | 17.33 | 17.66 | 26.86 | 20.71 | 20.71 | 20.71 | 20.71 | 20.71 |
| Inventories | 1,951.0 | 2,402.3 | 2,535.6 | 2,674.6 | 2,253.4 | 2,356.9 | 2,409.7 | 2,463.7 | 2,519.0 | 2,575.4 |
| Inventories, % | 17.94 | 19.32 | 19.16 | 23.07 | 19.32 | 19.76 | 19.76 | 19.76 | 19.76 | 19.76 |
| Accounts Payable | 1,758.8 | 2,439.3 | 2,374.8 | 2,702.9 | 2,265.6 | 2,301.1 | 2,352.7 | 2,405.5 | 2,459.4 | 2,514.5 |
| Accounts Payable, % | 16.17 | 19.62 | 17.95 | 23.31 | 19.42 | 19.29 | 19.29 | 19.29 | 19.29 | 19.29 |
| Capital Expenditure | -1,231.2 | -1,256.4 | -1,131.2 | -1,284.1 | -956.3 | -1,174.7 | -1,201.0 | -1,228.0 | -1,255.5 | -1,283.6 |
| Capital Expenditure, % | -11.32 | -10.11 | -8.55 | -11.08 | -8.2 | -9.85 | -9.85 | -9.85 | -9.85 | -9.85 |
| Tax Rate, % | -86.28 | -86.28 | -86.28 | -86.28 | -86.28 | -86.28 | -86.28 | -86.28 | -86.28 | -86.28 |
| EBITAT | 826.9 | 773.5 | 501.0 | 442.4 | 1,990.0 | 770.6 | 787.9 | 805.5 | 823.6 | 842.0 |
| Depreciation | ||||||||||
| Changes in Account Receivables | ||||||||||
| Changes in Inventories | ||||||||||
| Changes in Accounts Payable | ||||||||||
| Capital Expenditure | ||||||||||
| UFCF | -2,096.2 | -17.1 | 325.6 | 451.4 | 858.6 | 986.2 | 343.2 | 350.9 | 358.8 | 366.9 |
| WACC, % | 4.69 | 4.6 | 4.02 | 4.18 | 5.69 | 4.64 | 4.64 | 4.64 | 4.64 | 4.64 |
| PV UFCF | ||||||||||
| SUM PV UFCF | 2,154.1 | |||||||||
| Long Term Growth Rate, % | 3.00 | |||||||||
| Free cash flow (T + 1) | 378 | |||||||||
| Terminal Value | 23,081 | |||||||||
| Present Terminal Value | 18,401 | |||||||||
| Enterprise Value | 20,555 | |||||||||
| Net Debt | 3,268 | |||||||||
| Equity Value | 17,287 | |||||||||
| Diluted Shares Outstanding, MM | 1,975 | |||||||||
| Equity Value Per Share | 8.75 |
What You Will Receive
- Authentic Huapont Data: Preloaded financial metrics – covering revenue to EBIT – derived from actual and projected statistics.
- Comprehensive Customization: Modify all essential parameters (yellow cells) such as WACC, growth %, and tax rates at your convenience.
- Immediate Valuation Updates: Automatic recalculations to evaluate the effects of adjustments on Huapont's fair value.
- Flexible Excel Template: Designed for quick alterations, scenario analysis, and in-depth projections.
- Efficient and Precise: Eliminate the need to build models from the ground up while ensuring accuracy and adaptability.
Key Features
- Comprehensive DCF Calculator: Offers detailed unlevered and levered DCF valuation frameworks tailored for Huapont Life Sciences Co., Ltd. (002004SZ).
- WACC Calculator: Features a pre-configured Weighted Average Cost of Capital template with adjustable inputs to suit your analysis.
- Customizable Forecast Assumptions: Easily adjust growth rates, capital expenditures, and discount rates to align with market conditions.
- Integrated Financial Ratios: Evaluate profitability, leverage, and efficiency ratios specifically for Huapont Life Sciences Co., Ltd. (002004SZ).
- Dynamic Dashboard and Visual Charts: Generate visual summaries of essential valuation metrics for quick and effective analysis.
How It Works
- Step 1: Download the Excel spreadsheet.
- Step 2: Examine the pre-populated financial data and forecasts for Huapont Life Sciences Co., Ltd. (002004SZ).
- Step 3: Adjust key inputs such as revenue growth, WACC, and tax rates (highlighted cells).
- Step 4: Observe the DCF model refresh in real-time as you modify the assumptions.
- Step 5: Evaluate the results and leverage the insights for your investment strategies.
Why Opt for This Calculator?
- User-Friendly: Perfectly crafted for both novices and seasoned users.
- Customizable Inputs: Effortlessly adjust parameters to suit your analysis needs.
- Real-Time Feedback: Watch immediate updates to Huapont Life Sciences' valuation as you alter inputs.
- Pre-Loaded Data: Comes equipped with Huapont Life Sciences' actual financial figures for swift evaluations.
- Relied Upon by Experts: Favored by investors and analysts for making strategic decisions.
Who Can Benefit from This Product?
- Professional Investors: Create comprehensive and trustworthy valuation models for analyzing portfolios related to Huapont Life Sciences Co., Ltd. (002004SZ).
- Corporate Finance Teams: Evaluate valuation scenarios to inform strategic decisions within the organization.
- Consultants and Advisors: Deliver precise valuation insights for clients interested in Huapont Life Sciences Co., Ltd. (002004SZ).
- Students and Educators: Utilize real-world data to enhance their understanding and instruction of financial modeling techniques.
- Biotech Enthusiasts: Gain insights into how life sciences companies, such as Huapont Life Sciences Co., Ltd. (002004SZ), are valued in the market.
Contents of the Template
- Historical Data: Contains Huapont Life Sciences' previous financial performance and baseline forecasts.
- DCF and Levered DCF Models: Comprehensive templates for estimating Huapont's intrinsic value.
- WACC Sheet: Pre-calculated metrics for the Weighted Average Cost of Capital.
- Editable Inputs: Adjust critical factors such as growth rates, EBITDA margins, and CAPEX assumptions.
- Quarterly and Annual Statements: A thorough analysis of Huapont's financial reports.
- Interactive Dashboard: Visualize valuation outcomes and forecasts interactively.
Disclaimer
All information, articles, and product details provided on this website are for general informational and educational purposes only. We do not claim any ownership over, nor do we intend to infringe upon, any trademarks, copyrights, logos, brand names, or other intellectual property mentioned or depicted on this site. Such intellectual property remains the property of its respective owners, and any references here are made solely for identification or informational purposes, without implying any affiliation, endorsement, or partnership.
We make no representations or warranties, express or implied, regarding the accuracy, completeness, or suitability of any content or products presented. Nothing on this website should be construed as legal, tax, investment, financial, medical, or other professional advice. In addition, no part of this site—including articles or product references—constitutes a solicitation, recommendation, endorsement, advertisement, or offer to buy or sell any securities, franchises, or other financial instruments, particularly in jurisdictions where such activity would be unlawful.
All content is of a general nature and may not address the specific circumstances of any individual or entity. It is not a substitute for professional advice or services. Any actions you take based on the information provided here are strictly at your own risk. You accept full responsibility for any decisions or outcomes arising from your use of this website and agree to release us from any liability in connection with your use of, or reliance upon, the content or products found herein.