
|
Transfar Zhilian Co., Ltd. (002010.sz) Avaliação DCF |
Totalmente Editável: Adapte-Se Às Suas Necessidades No Excel Ou Planilhas
Design Profissional: Modelos Confiáveis E Padrão Da Indústria
Pré-Construídos Para Uso Rápido E Eficiente
Compatível com MAC/PC, totalmente desbloqueado
Não É Necessária Experiência; Fácil De Seguir
Transfar Zhilian Co., Ltd. (002010.SZ) Bundle
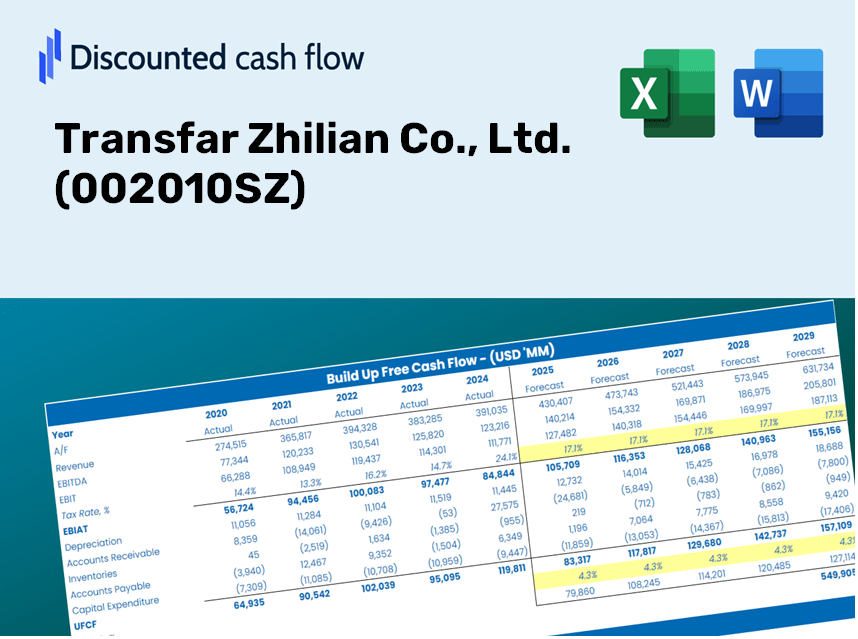
Como investidor ou analista, esta calculadora DCF (002010SZ) é o seu recurso preferido para uma avaliação precisa. Carregado com dados reais da Transfar Zhilian Co., Ltd., você pode ajustar as previsões e observar os efeitos em tempo real.
Discounted Cash Flow (DCF) - (USD MM)
| Year | AY1 2020 |
AY2 2021 |
AY3 2022 |
AY4 2023 |
AY5 2024 |
FY1 2025 |
FY2 2026 |
FY3 2027 |
FY4 2028 |
FY5 2029 |
|---|---|---|---|---|---|---|---|---|---|---|
| Revenue | 21,640.5 | 35,511.8 | 36,997.7 | 33,637.3 | 26,717.4 | 29,297.4 | 32,126.7 | 35,229.2 | 38,631.2 | 42,361.9 |
| Revenue Growth, % | 0 | 64.1 | 4.18 | -9.08 | -20.57 | 9.66 | 9.66 | 9.66 | 9.66 | 9.66 |
| EBITDA | 1,418.5 | 3,234.6 | 1,421.3 | 1,555.2 | 1,265.2 | 1,691.3 | 1,854.6 | 2,033.7 | 2,230.1 | 2,445.5 |
| EBITDA, % | 6.55 | 9.11 | 3.84 | 4.62 | 4.74 | 5.77 | 5.77 | 5.77 | 5.77 | 5.77 |
| Depreciation | 291.8 | 266.9 | 257.7 | 445.2 | 321.0 | 311.8 | 341.9 | 375.0 | 411.2 | 450.9 |
| Depreciation, % | 1.35 | 0.75155 | 0.69663 | 1.32 | 1.2 | 1.06 | 1.06 | 1.06 | 1.06 | 1.06 |
| EBIT | 1,126.7 | 2,967.7 | 1,163.6 | 1,110.0 | 944.2 | 1,379.5 | 1,512.7 | 1,658.8 | 1,818.9 | 1,994.6 |
| EBIT, % | 5.21 | 8.36 | 3.15 | 3.3 | 3.53 | 4.71 | 4.71 | 4.71 | 4.71 | 4.71 |
| Total Cash | 5,228.0 | 5,785.5 | 6,171.2 | 5,093.8 | 6,543.8 | 5,670.0 | 6,217.5 | 6,818.0 | 7,476.4 | 8,198.4 |
| Total Cash, percent | .0 | .0 | .0 | .0 | .0 | .0 | .0 | .0 | .0 | .0 |
| Account Receivables | 3,211.6 | 7,366.9 | 3,681.7 | 3,319.7 | 5,382.7 | 4,427.0 | 4,854.5 | 5,323.3 | 5,837.4 | 6,401.1 |
| Account Receivables, % | 14.84 | 20.75 | 9.95 | 9.87 | 20.15 | 15.11 | 15.11 | 15.11 | 15.11 | 15.11 |
| Inventories | 1,484.9 | 2,664.2 | 2,240.1 | 2,119.1 | 1,758.0 | 1,951.1 | 2,139.5 | 2,346.1 | 2,572.7 | 2,821.2 |
| Inventories, % | 6.86 | 7.5 | 6.05 | 6.3 | 6.58 | 6.66 | 6.66 | 6.66 | 6.66 | 6.66 |
| Accounts Payable | 1,506.0 | 2,348.9 | 2,065.7 | 1,989.8 | 2,169.5 | 1,944.9 | 2,132.8 | 2,338.7 | 2,564.6 | 2,812.2 |
| Accounts Payable, % | 6.96 | 6.61 | 5.58 | 5.92 | 8.12 | 6.64 | 6.64 | 6.64 | 6.64 | 6.64 |
| Capital Expenditure | -2,243.9 | -3,152.2 | -1,743.2 | -1,394.1 | -1,064.7 | -1,880.1 | -2,061.7 | -2,260.8 | -2,479.1 | -2,718.5 |
| Capital Expenditure, % | -10.37 | -8.88 | -4.71 | -4.14 | -3.99 | -6.42 | -6.42 | -6.42 | -6.42 | -6.42 |
| Tax Rate, % | 68.89 | 68.89 | 68.89 | 68.89 | 68.89 | 68.89 | 68.89 | 68.89 | 68.89 | 68.89 |
| EBITAT | 915.9 | 2,285.7 | 755.6 | 693.3 | 293.7 | 874.1 | 958.5 | 1,051.0 | 1,152.5 | 1,263.8 |
| Depreciation | ||||||||||
| Changes in Account Receivables | ||||||||||
| Changes in Inventories | ||||||||||
| Changes in Accounts Payable | ||||||||||
| Capital Expenditure | ||||||||||
| UFCF | -4,226.6 | -5,091.4 | 3,096.3 | 151.5 | -1,972.3 | -156.2 | -1,189.4 | -1,304.2 | -1,430.2 | -1,568.3 |
| WACC, % | 5.39 | 5.31 | 5.1 | 5.06 | 4.5 | 5.07 | 5.07 | 5.07 | 5.07 | 5.07 |
| PV UFCF | ||||||||||
| SUM PV UFCF | -4,748.3 | |||||||||
| Long Term Growth Rate, % | 3.00 | |||||||||
| Free cash flow (T + 1) | -1,615 | |||||||||
| Terminal Value | -77,970 | |||||||||
| Present Terminal Value | -60,884 | |||||||||
| Enterprise Value | -65,632 | |||||||||
| Net Debt | 5,481 | |||||||||
| Equity Value | -71,113 | |||||||||
| Diluted Shares Outstanding, MM | 3,033 | |||||||||
| Equity Value Per Share | -23.45 |
What You Will Receive
- Authentic Transfar Zhilian Data: Preloaded financial metrics – ranging from revenue to EBIT – derived from both actual and projected figures.
- Comprehensive Customization: Modify all essential parameters (yellow cells) such as WACC, growth %, and tax rates to fit your analysis.
- Immediate Valuation Adjustments: Automatic recalculations that allow you to assess how changes affect the fair value of Transfar Zhilian (002010SZ).
- Flexible Excel Template: Designed for quick modifications, scenario analysis, and thorough projections.
- Efficient and Precise: Avoid the hassle of building models from the ground up while ensuring accuracy and adaptability.
Key Features of Transfar Zhilian Co., Ltd. (002010SZ)
- Customizable Forecast Inputs: Adjust essential parameters such as revenue growth, EBITDA percentage, and capital expenditures.
- Instant DCF Valuation: Quickly computes intrinsic value, NPV, and various outputs at the click of a button.
- High-Precision Accuracy: Leverages Transfar's actual financial data for credible valuation results.
- Simplified Scenario Analysis: Easily explore different assumptions and evaluate their impacts with ease.
- Efficiency-Boosting Tool: Avoid the hassle of constructing intricate valuation models from the ground up.
How It Works
- Step 1: Download the prebuilt Excel template that includes data for Transfar Zhilian Co., Ltd. (002010SZ).
- Step 2: Review the pre-filled sheets to gain insights into the key performance indicators.
- Step 3: Adjust forecasts and assumptions in the editable yellow cells (WACC, growth rates, profit margins).
- Step 4: Immediately see the recalibrated results, featuring the intrinsic value of Transfar Zhilian Co., Ltd. (002010SZ).
- Step 5: Utilize the generated outputs to make well-informed investment choices or create detailed reports.
Why Choose This Calculator for Transfar Zhilian Co., Ltd. (002010SZ)?
- User-Friendly Interface: Crafted for both novices and experts to navigate effortlessly.
- Customizable Inputs: Modify assumptions easily to suit your specific analysis needs.
- Real-Time Valuation Updates: Observe immediate changes in Transfar Zhilian’s valuation as you adjust the data.
- Preloaded Financials: Equipped with Transfar Zhilian’s actual financial metrics for swift assessments.
- Relied Upon by Experts: Favored by investors and analysts for making well-informed financial choices.
Who Can Benefit from This Product?
- Investors: Evaluate the true value of Transfar Zhilian Co., Ltd. (002010SZ) before making investment choices.
- CFOs: Utilize a robust DCF model for accurate financial reporting and analysis.
- Consultants: Easily modify the template for client valuation reports.
- Entrepreneurs: Discover financial modeling techniques employed by leading companies.
- Educators: Implement it as a teaching aid to illustrate valuation methods.
What the Template Includes
- Pre-Filled DCF Model: Transfar Zhilian Co., Ltd. (002010SZ) financial data preloaded for immediate analysis.
- WACC Calculator: Comprehensive calculations for the Weighted Average Cost of Capital.
- Financial Ratios: Assess Transfar Zhilian’s profitability, leverage, and operational efficiency.
- Editable Inputs: Modify assumptions such as growth rates, margins, and CAPEX to suit your scenarios.
- Financial Statements: Access annual and quarterly reports for in-depth analysis.
- Interactive Dashboard: Visualize key valuation metrics and results with ease.
Disclaimer
All information, articles, and product details provided on this website are for general informational and educational purposes only. We do not claim any ownership over, nor do we intend to infringe upon, any trademarks, copyrights, logos, brand names, or other intellectual property mentioned or depicted on this site. Such intellectual property remains the property of its respective owners, and any references here are made solely for identification or informational purposes, without implying any affiliation, endorsement, or partnership.
We make no representations or warranties, express or implied, regarding the accuracy, completeness, or suitability of any content or products presented. Nothing on this website should be construed as legal, tax, investment, financial, medical, or other professional advice. In addition, no part of this site—including articles or product references—constitutes a solicitation, recommendation, endorsement, advertisement, or offer to buy or sell any securities, franchises, or other financial instruments, particularly in jurisdictions where such activity would be unlawful.
All content is of a general nature and may not address the specific circumstances of any individual or entity. It is not a substitute for professional advice or services. Any actions you take based on the information provided here are strictly at your own risk. You accept full responsibility for any decisions or outcomes arising from your use of this website and agree to release us from any liability in connection with your use of, or reliance upon, the content or products found herein.