
|
Sieyuan Electric Co., Ltd. (002028.sz) Avaliação DCF |
Totalmente Editável: Adapte-Se Às Suas Necessidades No Excel Ou Planilhas
Design Profissional: Modelos Confiáveis E Padrão Da Indústria
Pré-Construídos Para Uso Rápido E Eficiente
Compatível com MAC/PC, totalmente desbloqueado
Não É Necessária Experiência; Fácil De Seguir
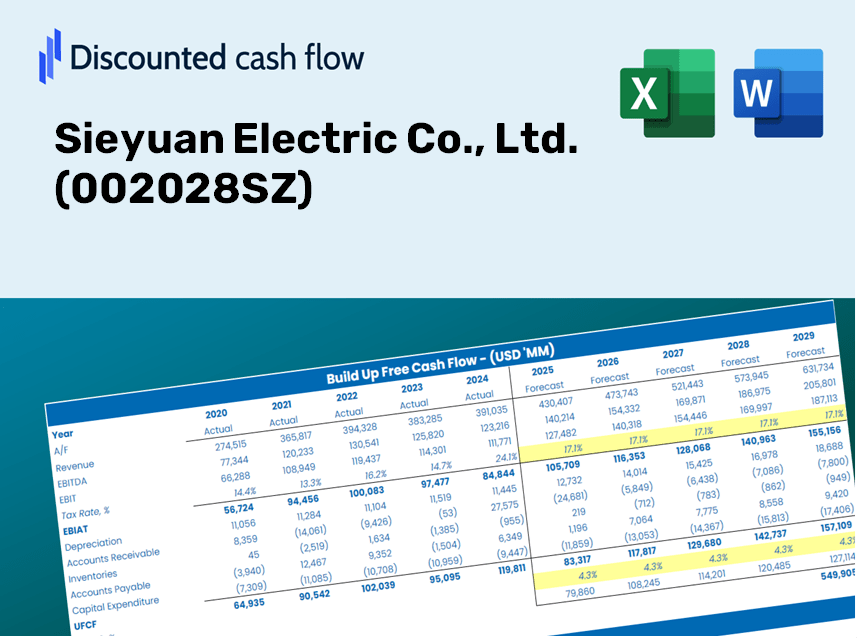
Sieyuan Electric Co., Ltd. (002028.SZ) Bundle
Descubra o verdadeiro potencial da Sieyuan Electric Co., Ltd. (002028SZ) com nossa calculadora DCF avançada! Ajuste as principais suposições, explore vários cenários e avalie como as mudanças afetam a avaliação da Sieyuan Electric Co., Ltd. (002028SZ)-tudo dentro de um modelo de excel amigável.
Discounted Cash Flow (DCF) - (USD MM)
| Year | AY1 2020 |
AY2 2021 |
AY3 2022 |
AY4 2023 |
AY5 2024 |
FY1 2025 |
FY2 2026 |
FY3 2027 |
FY4 2028 |
FY5 2029 |
|---|---|---|---|---|---|---|---|---|---|---|
| Revenue | 7,372.5 | 8,695.3 | 10,537.1 | 12,460.0 | 15,458.1 | 18,605.1 | 22,392.8 | 26,951.7 | 32,438.6 | 39,042.6 |
| Revenue Growth, % | 0 | 17.94 | 21.18 | 18.25 | 24.06 | 20.36 | 20.36 | 20.36 | 20.36 | 20.36 |
| EBITDA | 1,209.8 | 1,510.1 | 1,489.4 | 1,971.1 | 2,720.7 | 3,026.4 | 3,642.5 | 4,384.0 | 5,276.5 | 6,350.8 |
| EBITDA, % | 16.41 | 17.37 | 14.13 | 15.82 | 17.6 | 16.27 | 16.27 | 16.27 | 16.27 | 16.27 |
| Depreciation | 80.6 | 91.0 | 139.0 | 193.2 | 255.1 | 247.8 | 298.3 | 359.0 | 432.1 | 520.0 |
| Depreciation, % | 1.09 | 1.05 | 1.32 | 1.55 | 1.65 | 1.33 | 1.33 | 1.33 | 1.33 | 1.33 |
| EBIT | 1,129.2 | 1,419.1 | 1,350.4 | 1,777.9 | 2,465.6 | 2,778.5 | 3,344.2 | 4,025.1 | 4,844.5 | 5,830.8 |
| EBIT, % | 15.32 | 16.32 | 12.82 | 14.27 | 15.95 | 14.93 | 14.93 | 14.93 | 14.93 | 14.93 |
| Total Cash | 2,336.5 | 2,038.8 | 3,616.8 | 4,939.8 | 6,679.1 | 6,411.9 | 7,717.3 | 9,288.4 | 11,179.4 | 13,455.4 |
| Total Cash, percent | .0 | .0 | .0 | .0 | .0 | .0 | .0 | .0 | .0 | .0 |
| Account Receivables | 3,645.2 | 4,562.5 | 5,528.1 | 6,278.4 | 8,022.8 | 9,550.6 | 11,494.9 | 13,835.1 | 16,651.8 | 20,041.8 |
| Account Receivables, % | 49.44 | 52.47 | 52.46 | 50.39 | 51.9 | 51.33 | 51.33 | 51.33 | 51.33 | 51.33 |
| Inventories | 1,910.8 | 2,606.8 | 2,458.7 | 2,860.8 | 3,477.0 | 4,639.5 | 5,584.0 | 6,720.8 | 8,089.1 | 9,735.9 |
| Inventories, % | 25.92 | 29.98 | 23.33 | 22.96 | 22.49 | 24.94 | 24.94 | 24.94 | 24.94 | 24.94 |
| Accounts Payable | 2,632.4 | 3,329.0 | 3,067.8 | 4,967.2 | 6,485.3 | 6,881.0 | 8,281.9 | 9,968.0 | 11,997.3 | 14,439.8 |
| Accounts Payable, % | 35.71 | 38.28 | 29.11 | 39.86 | 41.95 | 36.98 | 36.98 | 36.98 | 36.98 | 36.98 |
| Capital Expenditure | -317.5 | -539.7 | -445.4 | -732.7 | -921.8 | -989.2 | -1,190.6 | -1,433.0 | -1,724.7 | -2,075.8 |
| Capital Expenditure, % | -4.31 | -6.21 | -4.23 | -5.88 | -5.96 | -5.32 | -5.32 | -5.32 | -5.32 | -5.32 |
| Tax Rate, % | 15.69 | 15.69 | 15.69 | 15.69 | 15.69 | 15.69 | 15.69 | 15.69 | 15.69 | 15.69 |
| EBITAT | 945.3 | 1,210.8 | 1,238.2 | 1,564.9 | 2,078.6 | 2,406.5 | 2,896.4 | 3,486.1 | 4,195.8 | 5,050.0 |
| Depreciation | ||||||||||
| Changes in Account Receivables | ||||||||||
| Changes in Inventories | ||||||||||
| Changes in Accounts Payable | ||||||||||
| Capital Expenditure | ||||||||||
| UFCF | -2,215.1 | -154.8 | -146.8 | 1,772.4 | 569.6 | -629.5 | 516.1 | 621.2 | 747.6 | 899.8 |
| WACC, % | 5.87 | 5.87 | 5.87 | 5.87 | 5.87 | 5.87 | 5.87 | 5.87 | 5.87 | 5.87 |
| PV UFCF | ||||||||||
| SUM PV UFCF | 1,661.2 | |||||||||
| Long Term Growth Rate, % | 3.50 | |||||||||
| Free cash flow (T + 1) | 931 | |||||||||
| Terminal Value | 39,351 | |||||||||
| Present Terminal Value | 29,591 | |||||||||
| Enterprise Value | 31,252 | |||||||||
| Net Debt | -3,835 | |||||||||
| Equity Value | 35,087 | |||||||||
| Diluted Shares Outstanding, MM | 776 | |||||||||
| Equity Value Per Share | 45.21 |
What You Will Receive
- Genuine Sieyuan Financial Data: Access to both historical and projected figures for precise valuation.
- Customizable Parameters: Adjust factors like WACC, tax rates, revenue growth, and capital expenditures.
- Dynamic Calculations: Intrinsic value and NPV are automatically computed.
- Scenario Testing: Evaluate multiple scenarios to analyze Sieyuan's future performance.
- User-Friendly Interface: Designed for professionals while remaining accessible for newcomers.
Key Features
- Customizable Forecast Inputs: Adjust essential parameters such as revenue growth, EBITDA margin, and capital investments.
- Instant DCF Valuation: Quickly computes intrinsic value, net present value, and additional financial metrics.
- High-Precision Accuracy: Leverages Sieyuan Electric’s real financial data for reliable valuation results.
- Effortless Scenario Analysis: Easily explore various assumptions and analyze their impacts side by side.
- Efficiency Booster: Avoid the hassle of developing intricate valuation models from the ground up.
How It Works
- Step 1: Download the Excel file.
- Step 2: Examine Sieyuan Electric Co., Ltd.'s pre-filled financial data and forecasts.
- Step 3: Adjust key inputs such as revenue growth, WACC, and tax rates (highlighted cells).
- Step 4: Observe the DCF model update in real-time as you alter assumptions.
- Step 5: Evaluate the output and leverage the findings for your investment strategies.
Why Opt for This Calculator?
- All-in-One Solution: Features DCF, WACC, and financial ratio analyses tailored for Sieyuan Electric Co., Ltd. (002028SZ).
- Flexible Input Options: Modify the yellow-highlighted cells to explore different financial scenarios.
- In-Depth Analysis: Automatically computes the intrinsic value and Net Present Value for Sieyuan Electric Co., Ltd. (002028SZ).
- Pre-Loaded Information: Access to both historical and projected data for a solid foundation.
- Expert-Level Tool: Perfect for financial analysts, investors, and business consultants working with Sieyuan Electric Co., Ltd. (002028SZ).
Who Can Benefit from Sieyuan Electric Co., Ltd. ([002028SZ])?
- Investors: Make informed investment choices with our advanced valuation tool tailored for Sieyuan Electric.
- Financial Analysts: Streamline your analysis process with a customizable DCF model specifically designed for [002028SZ].
- Consultants: Effortlessly modify our template for client proposals or presentations regarding Sieyuan Electric.
- Finance Enthusiasts: Enhance your grasp of valuation methods through practical examples related to [002028SZ].
- Educators and Students: Utilize this tool as an effective resource for financial education in courses focusing on the industry.
Contents of the Template
- Comprehensive DCF Model: An editable template featuring intricate valuation calculations.
- Real-World Data: Preloaded historical and projected financial information for Sieyuan Electric Co., Ltd. (002028SZ) for thorough analysis.
- Customizable Parameters: Modify WACC, growth rates, and tax assumptions to explore various scenarios.
- Financial Statements: Complete annual and quarterly breakdowns for enhanced insights.
- Key Ratios: Integrated analysis tools for evaluating profitability, efficiency, and leverage.
- Dashboard with Visual Outputs: Visual representations such as charts and tables for clear, actionable insights.
Disclaimer
All information, articles, and product details provided on this website are for general informational and educational purposes only. We do not claim any ownership over, nor do we intend to infringe upon, any trademarks, copyrights, logos, brand names, or other intellectual property mentioned or depicted on this site. Such intellectual property remains the property of its respective owners, and any references here are made solely for identification or informational purposes, without implying any affiliation, endorsement, or partnership.
We make no representations or warranties, express or implied, regarding the accuracy, completeness, or suitability of any content or products presented. Nothing on this website should be construed as legal, tax, investment, financial, medical, or other professional advice. In addition, no part of this site—including articles or product references—constitutes a solicitation, recommendation, endorsement, advertisement, or offer to buy or sell any securities, franchises, or other financial instruments, particularly in jurisdictions where such activity would be unlawful.
All content is of a general nature and may not address the specific circumstances of any individual or entity. It is not a substitute for professional advice or services. Any actions you take based on the information provided here are strictly at your own risk. You accept full responsibility for any decisions or outcomes arising from your use of this website and agree to release us from any liability in connection with your use of, or reliance upon, the content or products found herein.