
|
Unigroup Guoxin Microelectronics Co., Ltd. (002049.SZ) Avaliação DCF |
Totalmente Editável: Adapte-Se Às Suas Necessidades No Excel Ou Planilhas
Design Profissional: Modelos Confiáveis E Padrão Da Indústria
Pré-Construídos Para Uso Rápido E Eficiente
Compatível com MAC/PC, totalmente desbloqueado
Não É Necessária Experiência; Fácil De Seguir
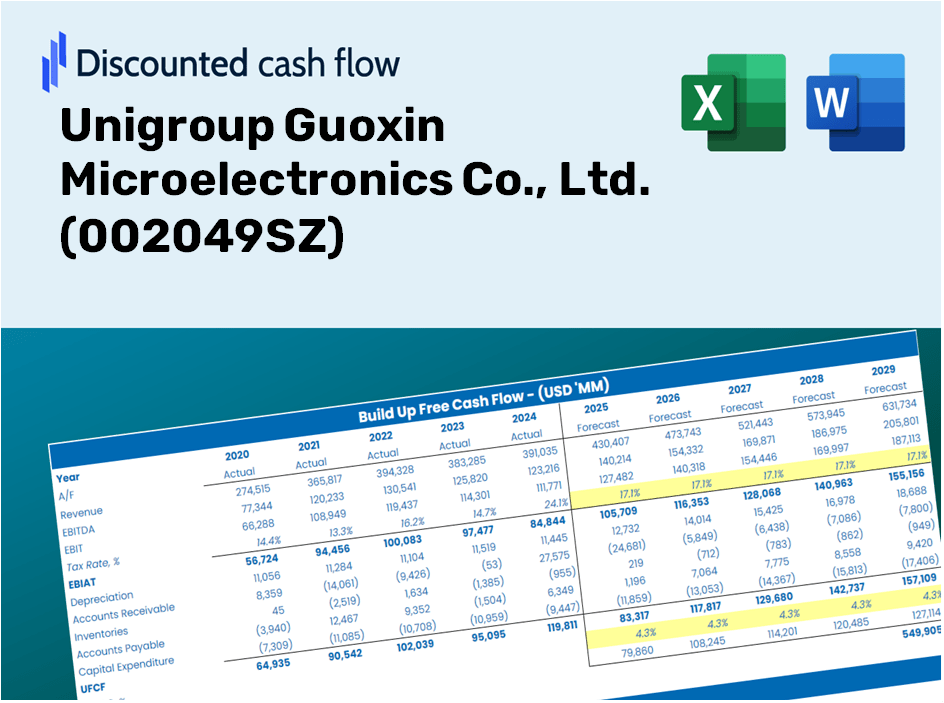
Unigroup Guoxin Microelectronics Co., Ltd. (002049.SZ) Bundle
Explore as perspectivas financeiras da Unigroup Guoxin Microelectronics Co., Ltd. (002049SZ) com nossa calculadora DCF! Digite suas suposições sobre crescimento, margens e despesas para calcular o valor intrínseco da Unigroup Guoxin Microelectronics Co., Ltd. (002049SZ) e aprimore sua estratégia de investimento.
Discounted Cash Flow (DCF) - (USD MM)
| Year | AY1 2020 |
AY2 2021 |
AY3 2022 |
AY4 2023 |
AY5 2024 |
FY1 2025 |
FY2 2026 |
FY3 2027 |
FY4 2028 |
FY5 2029 |
|---|---|---|---|---|---|---|---|---|---|---|
| Revenue | 3,270.3 | 5,342.1 | 7,119.9 | 7,576.0 | 5,511.1 | 6,555.2 | 7,797.1 | 9,274.4 | 11,031.5 | 13,121.5 |
| Revenue Growth, % | 0 | 63.35 | 33.28 | 6.41 | -27.26 | 18.95 | 18.95 | 18.95 | 18.95 | 18.95 |
| EBITDA | 1,162.3 | 2,197.3 | 3,008.1 | 2,698.1 | 1,258.1 | 2,325.3 | 2,765.9 | 3,289.9 | 3,913.2 | 4,654.6 |
| EBITDA, % | 35.54 | 41.13 | 42.25 | 35.61 | 22.83 | 35.47 | 35.47 | 35.47 | 35.47 | 35.47 |
| Depreciation | 192.4 | 175.3 | 303.5 | 208.6 | 202.5 | 260.3 | 309.6 | 368.3 | 438.1 | 521.1 |
| Depreciation, % | 5.88 | 3.28 | 4.26 | 2.75 | 3.67 | 3.97 | 3.97 | 3.97 | 3.97 | 3.97 |
| EBIT | 969.9 | 2,022.0 | 2,704.6 | 2,489.5 | 1,055.6 | 2,065.0 | 2,456.2 | 2,921.6 | 3,475.1 | 4,133.5 |
| EBIT, % | 29.66 | 37.85 | 37.99 | 32.86 | 19.15 | 31.5 | 31.5 | 31.5 | 31.5 | 31.5 |
| Total Cash | 1,485.6 | 3,162.5 | 4,092.2 | 5,039.3 | 3,246.3 | 3,769.5 | 4,483.7 | 5,333.2 | 6,343.6 | 7,545.5 |
| Total Cash, percent | .0 | .0 | .0 | .0 | .0 | .0 | .0 | .0 | .0 | .0 |
| Account Receivables | 2,733.6 | 4,063.5 | 5,469.1 | 6,195.6 | 5,592.1 | 5,483.4 | 6,522.3 | 7,758.0 | 9,227.8 | 10,976.1 |
| Account Receivables, % | 83.59 | 76.07 | 76.81 | 81.78 | 101.47 | 83.65 | 83.65 | 83.65 | 83.65 | 83.65 |
| Inventories | 890.7 | 1,223.2 | 2,213.2 | 2,513.4 | 1,973.7 | 1,969.3 | 2,342.4 | 2,786.2 | 3,314.0 | 3,941.9 |
| Inventories, % | 27.24 | 22.9 | 31.09 | 33.18 | 35.81 | 30.04 | 30.04 | 30.04 | 30.04 | 30.04 |
| Accounts Payable | 1,012.0 | 1,223.0 | 436.0 | 1,436.2 | 194.8 | 1,081.0 | 1,285.8 | 1,529.4 | 1,819.2 | 2,163.9 |
| Accounts Payable, % | 30.95 | 22.89 | 6.12 | 18.96 | 3.53 | 16.49 | 16.49 | 16.49 | 16.49 | 16.49 |
| Capital Expenditure | -550.7 | -423.6 | -307.3 | -250.3 | -316.6 | -499.9 | -594.6 | -707.3 | -841.3 | -1,000.7 |
| Capital Expenditure, % | -16.84 | -7.93 | -4.32 | -3.3 | -5.74 | -7.63 | -7.63 | -7.63 | -7.63 | -7.63 |
| Tax Rate, % | 7.99 | 7.99 | 7.99 | 7.99 | 7.99 | 7.99 | 7.99 | 7.99 | 7.99 | 7.99 |
| EBITAT | 835.1 | 1,815.6 | 2,470.4 | 2,316.7 | 971.2 | 1,868.0 | 2,222.0 | 2,642.9 | 3,143.6 | 3,739.2 |
| Depreciation | ||||||||||
| Changes in Account Receivables | ||||||||||
| Changes in Inventories | ||||||||||
| Changes in Accounts Payable | ||||||||||
| Capital Expenditure | ||||||||||
| UFCF | -2,135.4 | 116.0 | -716.1 | 2,248.5 | 759.0 | 2,627.8 | 729.8 | 868.1 | 1,032.5 | 1,228.1 |
| WACC, % | 5.12 | 5.12 | 5.12 | 5.12 | 5.12 | 5.12 | 5.12 | 5.12 | 5.12 | 5.12 |
| PV UFCF | ||||||||||
| SUM PV UFCF | 5,709.6 | |||||||||
| Long Term Growth Rate, % | 3.50 | |||||||||
| Free cash flow (T + 1) | 1,271 | |||||||||
| Terminal Value | 78,356 | |||||||||
| Present Terminal Value | 61,037 | |||||||||
| Enterprise Value | 66,747 | |||||||||
| Net Debt | -840 | |||||||||
| Equity Value | 67,587 | |||||||||
| Diluted Shares Outstanding, MM | 843 | |||||||||
| Equity Value Per Share | 80.15 |
What You Will Gain
- Authentic (002049SZ) Financial Data: Features both historical and projected figures for precise valuation.
- Customizable Parameters: Adjust WACC, tax rates, revenue growth, and capital expenditures as needed.
- Automated Calculations: Intrinsic value and NPV are computed in real-time.
- Scenario Analysis: Explore various scenarios to assess Unigroup Guoxin's future outlook.
- Clear and User-Friendly Interface: Designed for industry experts while remaining accessible to newcomers.
Key Features
- Comprehensive DCF Calculator: Features detailed unlevered and levered DCF valuation models tailored for Unigroup Guoxin Microelectronics Co., Ltd. (002049SZ).
- WACC Estimator: A pre-configured Weighted Average Cost of Capital tool with customizable parameters for precise calculations.
- Customizable Forecast Metrics: Adjust growth projections, capital expenditure estimates, and discount rates to suit your analysis.
- Incorporated Financial Ratios: Evaluate profitability, leverage, and operational efficiency ratios specific to Unigroup Guoxin Microelectronics Co., Ltd. (002049SZ).
- Interactive Dashboard and Graphs: Visual representations that summarize essential valuation metrics for straightforward assessment.
How It Functions
- Download the Template: Gain immediate access to the Excel-based UGM DCF Calculator for Unigroup Guoxin Microelectronics Co., Ltd. (002049SZ).
- Input Your Assumptions: Modify the yellow-highlighted cells for growth rates, WACC, profit margins, and additional parameters.
- Instant Calculations: The model will automatically refresh to reflect the intrinsic value of Unigroup Guoxin Microelectronics Co., Ltd. (002049SZ).
- Test Scenarios: Experiment with various assumptions to assess potential changes in valuation.
- Analyze and Decide: Utilize the outcomes to inform your investment strategy or financial analysis.
Why Choose This Calculator for Unigroup Guoxin Microelectronics (002049SZ)?
- All-in-One Solution: Combines DCF, WACC, and financial ratio analyses tailored for Unigroup Guoxin Microelectronics.
- Flexible Inputs: Modify the yellow-highlighted fields to explore a range of financial scenarios.
- In-Depth Analysis: Automatically computes the intrinsic value and Net Present Value specific to Unigroup Guoxin Microelectronics.
- Built-In Data: Features both historical and projected data for enhanced accuracy in assessments.
- Top-Tier Quality: Perfect for financial analysts, investors, and business consultants focusing on the microelectronics sector.
Who Can Benefit from This Product?
- Engineering Students: Understand semiconductor design principles and apply them to real-world projects.
- Researchers: Utilize advanced models in their studies on microelectronics and integrated circuits.
- Investors: Evaluate your theories and assess the market performance of Unigroup Guoxin Microelectronics Co., Ltd. (002049SZ).
- Industry Analysts: Enhance your efficiency with a customizable model specifically designed for microelectronics valuation.
- Tech Entrepreneurs: Discover insights into how major players in the semiconductor industry, like Unigroup Guoxin, are evaluated.
Contents of the Template
- Preloaded Unigroup Guoxin Data: Historical and forecasted financial information, encompassing revenue, EBIT, and capital expenditures.
- DCF and WACC Models: Professional templates for assessing intrinsic value and calculating the Weighted Average Cost of Capital.
- Editable Inputs: Yellow-highlighted cells designated for modifying revenue growth, tax rates, and discount rates.
- Financial Statements: Detailed annual and quarterly financial data for thorough analysis.
- Key Ratios: Metrics on profitability, leverage, and operational efficiency for performance evaluation.
- Dashboard and Charts: Visual representations of valuation results and underlying assumptions.
Disclaimer
All information, articles, and product details provided on this website are for general informational and educational purposes only. We do not claim any ownership over, nor do we intend to infringe upon, any trademarks, copyrights, logos, brand names, or other intellectual property mentioned or depicted on this site. Such intellectual property remains the property of its respective owners, and any references here are made solely for identification or informational purposes, without implying any affiliation, endorsement, or partnership.
We make no representations or warranties, express or implied, regarding the accuracy, completeness, or suitability of any content or products presented. Nothing on this website should be construed as legal, tax, investment, financial, medical, or other professional advice. In addition, no part of this site—including articles or product references—constitutes a solicitation, recommendation, endorsement, advertisement, or offer to buy or sell any securities, franchises, or other financial instruments, particularly in jurisdictions where such activity would be unlawful.
All content is of a general nature and may not address the specific circumstances of any individual or entity. It is not a substitute for professional advice or services. Any actions you take based on the information provided here are strictly at your own risk. You accept full responsibility for any decisions or outcomes arising from your use of this website and agree to release us from any liability in connection with your use of, or reliance upon, the content or products found herein.