
|
SHANDONG SUNPAPER CO., LTD. (002078.SZ) Avaliação DCF |
Totalmente Editável: Adapte-Se Às Suas Necessidades No Excel Ou Planilhas
Design Profissional: Modelos Confiáveis E Padrão Da Indústria
Pré-Construídos Para Uso Rápido E Eficiente
Compatível com MAC/PC, totalmente desbloqueado
Não É Necessária Experiência; Fácil De Seguir
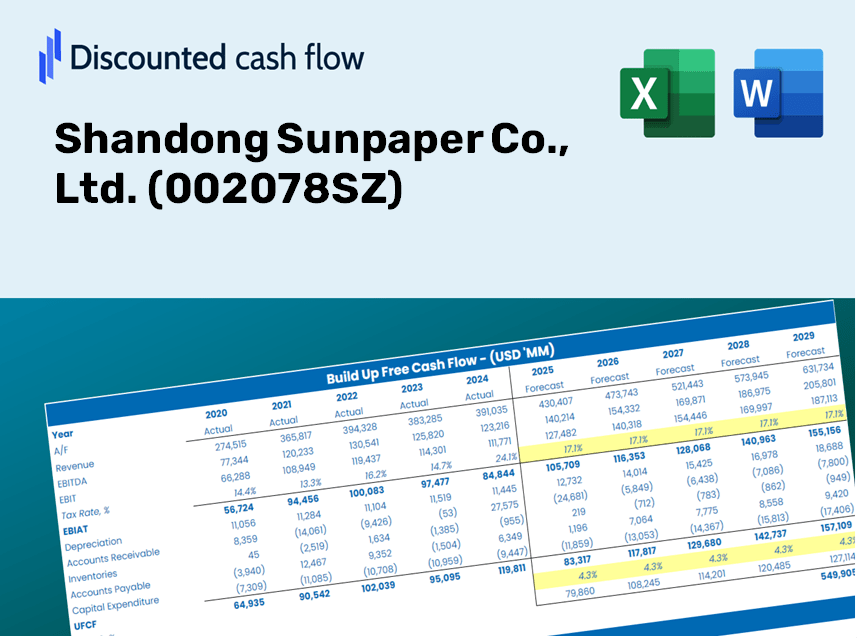
Shandong Sunpaper Co., Ltd. (002078.SZ) Bundle
Como investidor ou analista, a calculadora DCF da Shandong Sunpaper Co., Ltd. (002078SZ) é o seu recurso preferido para uma avaliação precisa. Carregado com dados reais do papel solar de Shandong, você pode ajustar as previsões e observar os efeitos em tempo real.
Discounted Cash Flow (DCF) - (USD MM)
| Year | AY1 2020 |
AY2 2021 |
AY3 2022 |
AY4 2023 |
AY5 2024 |
FY1 2025 |
FY2 2026 |
FY3 2027 |
FY4 2028 |
FY5 2029 |
|---|---|---|---|---|---|---|---|---|---|---|
| Revenue | 21,588.6 | 32,159.2 | 39,766.9 | 39,544.3 | 40,726.5 | 48,367.8 | 57,442.8 | 68,220.4 | 81,020.2 | 96,221.6 |
| Revenue Growth, % | 0 | 48.96 | 23.66 | -0.55972 | 2.99 | 18.76 | 18.76 | 18.76 | 18.76 | 18.76 |
| EBITDA | 4,303.2 | 5,649.8 | 5,918.1 | 6,210.4 | 6,765.4 | 8,193.5 | 9,730.8 | 11,556.5 | 13,724.8 | 16,299.9 |
| EBITDA, % | 19.93 | 17.57 | 14.88 | 15.71 | 16.61 | 16.94 | 16.94 | 16.94 | 16.94 | 16.94 |
| Depreciation | 1,433.6 | 1,756.9 | 2,047.3 | 2,156.7 | 2,354.6 | 2,755.8 | 3,272.8 | 3,886.9 | 4,616.1 | 5,482.3 |
| Depreciation, % | 6.64 | 5.46 | 5.15 | 5.45 | 5.78 | 5.7 | 5.7 | 5.7 | 5.7 | 5.7 |
| EBIT | 2,869.6 | 3,892.8 | 3,870.7 | 4,053.8 | 4,410.8 | 5,437.7 | 6,457.9 | 7,669.6 | 9,108.6 | 10,817.6 |
| EBIT, % | 13.29 | 12.1 | 9.73 | 10.25 | 10.83 | 11.24 | 11.24 | 11.24 | 11.24 | 11.24 |
| Total Cash | 2,969.7 | 3,467.7 | 2,390.7 | 2,495.1 | 3,233.7 | 4,333.8 | 5,146.9 | 6,112.6 | 7,259.5 | 8,621.6 |
| Total Cash, percent | .0 | .0 | .0 | .0 | .0 | .0 | .0 | .0 | .0 | .0 |
| Account Receivables | 3,774.1 | 3,071.7 | 3,934.4 | 4,511.2 | 4,020.2 | 5,630.6 | 6,687.0 | 7,941.7 | 9,431.7 | 11,201.4 |
| Account Receivables, % | 17.48 | 9.55 | 9.89 | 11.41 | 9.87 | 11.64 | 11.64 | 11.64 | 11.64 | 11.64 |
| Inventories | 2,896.6 | 3,506.5 | 5,339.1 | 4,574.4 | 4,751.7 | 5,899.1 | 7,005.9 | 8,320.4 | 9,881.6 | 11,735.6 |
| Inventories, % | 13.42 | 10.9 | 13.43 | 11.57 | 11.67 | 12.2 | 12.2 | 12.2 | 12.2 | 12.2 |
| Accounts Payable | 2,881.3 | 5,105.4 | 5,031.8 | 3,327.6 | 4,853.4 | 6,017.6 | 7,146.7 | 8,487.6 | 10,080.0 | 11,971.3 |
| Accounts Payable, % | 13.35 | 15.88 | 12.65 | 8.41 | 11.92 | 12.44 | 12.44 | 12.44 | 12.44 | 12.44 |
| Capital Expenditure | -6,308.7 | -7,249.0 | -4,712.4 | -4,774.3 | -5,581.2 | -8,647.3 | -10,269.7 | -12,196.5 | -14,484.9 | -17,202.6 |
| Capital Expenditure, % | -29.22 | -22.54 | -11.85 | -12.07 | -13.7 | -17.88 | -17.88 | -17.88 | -17.88 | -17.88 |
| Tax Rate, % | 13.42 | 13.42 | 13.42 | 13.42 | 13.42 | 13.42 | 13.42 | 13.42 | 13.42 | 13.42 |
| EBITAT | 2,356.6 | 3,406.0 | 3,543.8 | 3,768.1 | 3,818.9 | 4,792.8 | 5,692.1 | 6,760.1 | 8,028.4 | 9,534.7 |
| Depreciation | ||||||||||
| Changes in Account Receivables | ||||||||||
| Changes in Inventories | ||||||||||
| Changes in Accounts Payable | ||||||||||
| Capital Expenditure | ||||||||||
| UFCF | -6,307.9 | 230.5 | -1,890.0 | -365.8 | 2,431.7 | -2,692.3 | -2,339.0 | -2,777.8 | -3,299.0 | -3,918.0 |
| WACC, % | 4.61 | 4.67 | 4.72 | 4.74 | 4.66 | 4.68 | 4.68 | 4.68 | 4.68 | 4.68 |
| PV UFCF | ||||||||||
| SUM PV UFCF | -12,991.8 | |||||||||
| Long Term Growth Rate, % | 3.00 | |||||||||
| Free cash flow (T + 1) | -4,036 | |||||||||
| Terminal Value | -239,899 | |||||||||
| Present Terminal Value | -190,838 | |||||||||
| Enterprise Value | -203,830 | |||||||||
| Net Debt | 9,632 | |||||||||
| Equity Value | -213,462 | |||||||||
| Diluted Shares Outstanding, MM | 2,794 | |||||||||
| Equity Value Per Share | -76.40 |
What You Will Receive
- Genuine Shandong Sunpaper Data: Preloaded financial metrics – encompassing revenue to EBIT – derived from actual and projected figures.
- Comprehensive Customization: Modify all essential parameters (yellow cells) such as WACC, growth %, and tax rates.
- Immediate Valuation Updates: Automatic recalculations to assess the effects of changes on Shandong Sunpaper's fair value.
- Flexible Excel Template: Designed for quick edits, scenario analysis, and in-depth projections.
- Time-Efficient and Accurate: Eliminate the need to construct models from the ground up while ensuring precision and adaptability.
Core Features
- Genuine Shandong Sunpaper Financials: Obtain reliable pre-loaded historical data and forecasts for the future.
- Adjustable Forecast Inputs: Tailor the highlighted cells for WACC, growth rates, and profit margins as needed.
- Real-Time Calculations: Instant updates for DCF, Net Present Value (NPV), and cash flow assessments.
- Interactive Dashboard: Clear charts and summaries to help you visualize your evaluation results effectively.
- Suitable for All Experience Levels: An intuitive layout designed for investors, CFOs, and consultants alike.
How It Works
- Step 1: Download the pre-built Excel template featuring Shandong Sunpaper Co., Ltd. (002078SZ) data.
- Step 2: Review the pre-filled sheets to familiarize yourself with the essential metrics.
- Step 3: Adjust forecasts and assumptions in the editable yellow cells (WACC, growth, margins).
- Step 4: Instantly view recalculated outputs, including the intrinsic value of Shandong Sunpaper Co., Ltd. (002078SZ).
- Step 5: Use the results to make informed investment choices or prepare detailed reports.
Why Choose Shandong Sunpaper Co., Ltd. (002078SZ)?
- Save Time: Skip the hassle of building a financial model from scratch – our tools are ready for immediate use.
- Enhance Accuracy: Dependable financial metrics and calculations minimize valuation errors.
- Completely Customizable: Adjust the model to align with your specific assumptions and forecasts.
- User-Friendly: Intuitive charts and outputs simplify the analysis of results.
- Endorsed by Professionals: Built for experts who prioritize accuracy and functionality.
Who Should Consider This Product?
- Investors: Accurately assess the fair value of Shandong Sunpaper Co., Ltd. (002078SZ) prior to making investment choices.
- CFOs: Utilize a professional-grade DCF model for enhanced financial reporting and analysis.
- Consultants: Easily customize the template for valuation reports tailored to clients.
- Entrepreneurs: Discover insights into the financial modeling practices of leading companies.
- Educators: Employ it as a resource to teach valuation techniques effectively.
Contents of the Template
- Preloaded Sunpaper Data: Historical and projected financial information, including revenue, EBIT, and capital expenditures.
- DCF and WACC Models: Advanced spreadsheets for determining intrinsic value and Weighted Average Cost of Capital.
- Editable Inputs: Cells highlighted in yellow for modifying revenue growth, tax rates, and discount rates.
- Financial Statements: Detailed annual and quarterly financials for comprehensive analysis.
- Key Ratios: Profitability, leverage, and efficiency ratios for performance assessment.
- Dashboard and Charts: Visual representations of valuation results and underlying assumptions.
Disclaimer
All information, articles, and product details provided on this website are for general informational and educational purposes only. We do not claim any ownership over, nor do we intend to infringe upon, any trademarks, copyrights, logos, brand names, or other intellectual property mentioned or depicted on this site. Such intellectual property remains the property of its respective owners, and any references here are made solely for identification or informational purposes, without implying any affiliation, endorsement, or partnership.
We make no representations or warranties, express or implied, regarding the accuracy, completeness, or suitability of any content or products presented. Nothing on this website should be construed as legal, tax, investment, financial, medical, or other professional advice. In addition, no part of this site—including articles or product references—constitutes a solicitation, recommendation, endorsement, advertisement, or offer to buy or sell any securities, franchises, or other financial instruments, particularly in jurisdictions where such activity would be unlawful.
All content is of a general nature and may not address the specific circumstances of any individual or entity. It is not a substitute for professional advice or services. Any actions you take based on the information provided here are strictly at your own risk. You accept full responsibility for any decisions or outcomes arising from your use of this website and agree to release us from any liability in connection with your use of, or reliance upon, the content or products found herein.