
|
Shenzhen Topband Co., Ltd. (002139.SZ) Avaliação DCF |
Totalmente Editável: Adapte-Se Às Suas Necessidades No Excel Ou Planilhas
Design Profissional: Modelos Confiáveis E Padrão Da Indústria
Pré-Construídos Para Uso Rápido E Eficiente
Compatível com MAC/PC, totalmente desbloqueado
Não É Necessária Experiência; Fácil De Seguir
Shenzhen Topband Co., Ltd. (002139.SZ) Bundle
Domine a análise de avaliação da Shenzhen Topband Co., Ltd. (002139SZ) com nossa calculadora DCF de ponta! Este modelo do Excel é pré -carregado com dados reais (002139SZ), permitindo que você ajuste as previsões e suposições para calcular com precisão o valor intrínseco da Shenzhen Topband Co., Ltd.
Discounted Cash Flow (DCF) - (USD MM)
| Year | AY1 2020 |
AY2 2021 |
AY3 2022 |
AY4 2023 |
AY5 2024 |
FY1 2025 |
FY2 2026 |
FY3 2027 |
FY4 2028 |
FY5 2029 |
|---|---|---|---|---|---|---|---|---|---|---|
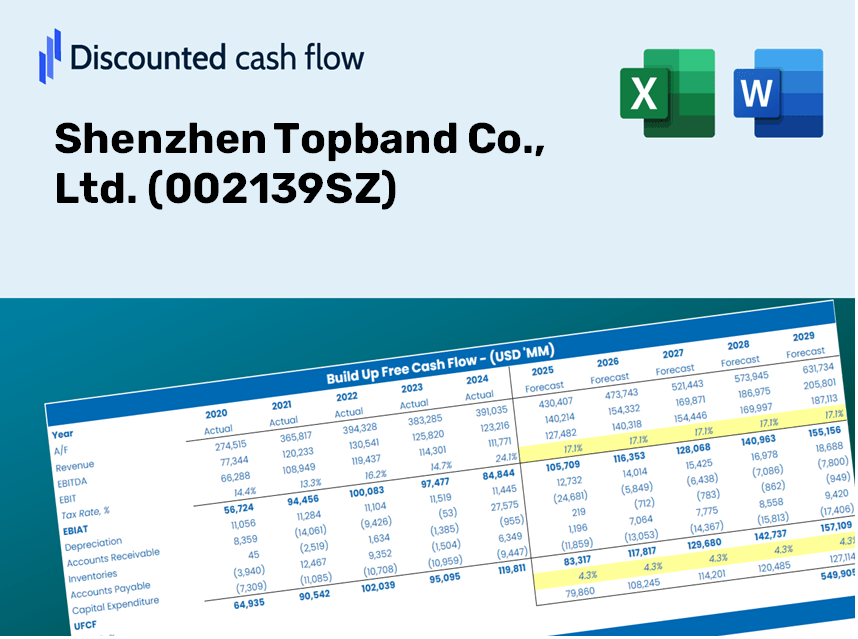
| Revenue | 5,560.2 | 7,767.0 | 8,875.1 | 8,992.3 | 10,501.2 | 12,392.9 | 14,625.4 | 17,260.1 | 20,369.4 | 24,038.8 |
| Revenue Growth, % | 0 | 39.69 | 14.27 | 1.32 | 16.78 | 18.01 | 18.01 | 18.01 | 18.01 | 18.01 |
| EBITDA | 855.9 | 866.0 | 972.8 | 887.4 | 1,256.3 | 1,470.7 | 1,735.6 | 2,048.3 | 2,417.3 | 2,852.7 |
| EBITDA, % | 15.39 | 11.15 | 10.96 | 9.87 | 11.96 | 11.87 | 11.87 | 11.87 | 11.87 | 11.87 |
| Depreciation | 150.1 | 215.0 | 298.7 | 320.7 | 432.0 | 409.3 | 483.0 | 570.1 | 672.7 | 793.9 |
| Depreciation, % | 2.7 | 2.77 | 3.37 | 3.57 | 4.11 | 3.3 | 3.3 | 3.3 | 3.3 | 3.3 |
| EBIT | 705.8 | 651.0 | 674.1 | 566.8 | 824.3 | 1,061.4 | 1,252.6 | 1,478.2 | 1,744.5 | 2,058.8 |
| EBIT, % | 12.69 | 8.38 | 7.6 | 6.3 | 7.85 | 8.56 | 8.56 | 8.56 | 8.56 | 8.56 |
| Total Cash | 1,445.6 | 1,982.6 | 1,746.0 | 2,207.2 | 2,453.4 | 2,952.1 | 3,483.9 | 4,111.5 | 4,852.2 | 5,726.3 |
| Total Cash, percent | .0 | .0 | .0 | .0 | .0 | .0 | .0 | .0 | .0 | .0 |
| Account Receivables | 1,987.2 | 2,386.7 | 2,934.3 | 2,764.5 | 3,211.1 | 3,986.9 | 4,705.1 | 5,552.7 | 6,552.9 | 7,733.4 |
| Account Receivables, % | 35.74 | 30.73 | 33.06 | 30.74 | 30.58 | 32.17 | 32.17 | 32.17 | 32.17 | 32.17 |
| Inventories | 1,115.3 | 2,184.4 | 1,993.0 | 1,653.8 | 1,810.5 | 2,634.0 | 3,108.5 | 3,668.5 | 4,329.3 | 5,109.2 |
| Inventories, % | 20.06 | 28.12 | 22.46 | 18.39 | 17.24 | 21.25 | 21.25 | 21.25 | 21.25 | 21.25 |
| Accounts Payable | 2,265.5 | 2,742.4 | 2,672.1 | 2,885.5 | 3,505.5 | 4,254.0 | 5,020.3 | 5,924.7 | 6,992.0 | 8,251.6 |
| Accounts Payable, % | 40.74 | 35.31 | 30.11 | 32.09 | 33.38 | 34.33 | 34.33 | 34.33 | 34.33 | 34.33 |
| Capital Expenditure | -573.8 | -854.2 | -734.7 | -796.9 | -748.1 | -1,129.8 | -1,333.3 | -1,573.5 | -1,856.9 | -2,191.4 |
| Capital Expenditure, % | -10.32 | -11 | -8.28 | -8.86 | -7.12 | -9.12 | -9.12 | -9.12 | -9.12 | -9.12 |
| Tax Rate, % | 13.34 | 13.34 | 13.34 | 13.34 | 13.34 | 13.34 | 13.34 | 13.34 | 13.34 | 13.34 |
| EBITAT | 606.3 | 592.9 | 620.6 | 552.7 | 714.3 | 962.1 | 1,135.4 | 1,339.9 | 1,581.3 | 1,866.1 |
| Depreciation | ||||||||||
| Changes in Account Receivables | ||||||||||
| Changes in Inventories | ||||||||||
| Changes in Accounts Payable | ||||||||||
| Capital Expenditure | ||||||||||
| UFCF | -654.5 | -1,037.9 | -241.7 | 798.6 | 415.1 | -609.2 | -141.2 | -166.7 | -196.7 | -232.1 |
| WACC, % | 6.39 | 6.4 | 6.41 | 6.42 | 6.39 | 6.4 | 6.4 | 6.4 | 6.4 | 6.4 |
| PV UFCF | ||||||||||
| SUM PV UFCF | -1,159.4 | |||||||||
| Long Term Growth Rate, % | 3.50 | |||||||||
| Free cash flow (T + 1) | -240 | |||||||||
| Terminal Value | -8,280 | |||||||||
| Present Terminal Value | -6,071 | |||||||||
| Enterprise Value | -7,231 | |||||||||
| Net Debt | -202 | |||||||||
| Equity Value | -7,029 | |||||||||
| Diluted Shares Outstanding, MM | 1,221 | |||||||||
| Equity Value Per Share | -5.76 |
What You Will Receive
- Comprehensive Financial Model: Utilizing Shenzhen Topband Co., Ltd.'s actual data for precise DCF valuation.
- Complete Forecast Control: Modify revenue growth, margins, WACC, and other crucial parameters.
- Real-Time Calculations: Automatic updates provide immediate feedback as you make adjustments.
- Investor-Ready Template: A polished Excel file crafted for high-quality valuation analysis.
- Customizable and Reusable: Designed for adaptability, enabling repeated use for thorough forecasts.
Key Features
- Customizable Forecast Inputs: Adjust essential parameters such as revenue growth, EBITDA margins, and capital expenditures.
- Instant DCF Valuation: Automatically computes intrinsic value, NPV, and various other financial metrics.
- High Precision Accuracy: Leverages Shenzhen Topband Co., Ltd.'s (002139SZ) actual financial data for credible valuation results.
- Effortless Scenario Analysis: Easily evaluate different scenarios and assess their impacts side by side.
- Efficiency Booster: Streamline your workflow by avoiding the hassle of constructing intricate valuation models from the ground up.
How It Works
- Download: Obtain the pre-packaged Excel file featuring Shenzhen Topband Co., Ltd.'s ([002139SZ]) financial data.
- Customize: Modify forecasts such as revenue growth, EBITDA %, and WACC to suit your analysis.
- Update Automatically: Watch as intrinsic value and NPV calculations refresh in real-time.
- Test Scenarios: Develop various projections and evaluate results instantly.
- Make Decisions: Utilize the valuation outcomes to inform your investment strategy.
Why Opt for This Calculator?
- Designed for Industry Experts: A sophisticated tool favored by financial analysts, CFOs, and consultants.
- Comprehensive Data: Shenzhen Topband Co., Ltd.'s (002139SZ) historical and projected financials included for precise analysis.
- Flexible Scenario Analysis: Effortlessly test various forecasts and assumptions.
- Intuitive Results: Automatically determines intrinsic value, NPV, and essential metrics.
- User-Friendly: Clear, step-by-step guidance makes the process straightforward.
Who Can Benefit from This Product?
- Institutional Investors: Develop accurate and comprehensive valuation models for analyzing portfolios related to Shenzhen Topband Co., Ltd. (002139SZ).
- Corporate Finance Departments: Evaluate valuation scenarios to inform company strategies and decision-making.
- Financial Consultants and Advisors: Deliver precise valuation insights for clients interested in Shenzhen Topband Co., Ltd. (002139SZ).
- Students and Instructors: Utilize real-time data to enhance learning and practice in financial modeling.
- Technology Aficionados: Gain insights into the market valuation of tech firms, including Shenzhen Topband Co., Ltd. (002139SZ).
Contents of the Template
- Operating and Balance Sheet Data: Pre-filled historical data and forecasts for Shenzhen Topband Co., Ltd. (002139SZ), including revenue, EBITDA, EBIT, and capital expenditures.
- WACC Calculation: A dedicated worksheet for Weighted Average Cost of Capital (WACC), incorporating key parameters like Beta, risk-free rate, and share price.
- DCF Valuation (Unlevered and Levered): Customizable Discounted Cash Flow models that demonstrate intrinsic value along with detailed calculations.
- Financial Statements: Pre-loaded financial statements (both annual and quarterly) to facilitate thorough analysis.
- Key Ratios: A compilation of profitability, leverage, and efficiency ratios for Shenzhen Topband Co., Ltd. (002139SZ).
- Dashboard and Charts: A visual overview of valuation outcomes and assumptions for straightforward result analysis.
Disclaimer
All information, articles, and product details provided on this website are for general informational and educational purposes only. We do not claim any ownership over, nor do we intend to infringe upon, any trademarks, copyrights, logos, brand names, or other intellectual property mentioned or depicted on this site. Such intellectual property remains the property of its respective owners, and any references here are made solely for identification or informational purposes, without implying any affiliation, endorsement, or partnership.
We make no representations or warranties, express or implied, regarding the accuracy, completeness, or suitability of any content or products presented. Nothing on this website should be construed as legal, tax, investment, financial, medical, or other professional advice. In addition, no part of this site—including articles or product references—constitutes a solicitation, recommendation, endorsement, advertisement, or offer to buy or sell any securities, franchises, or other financial instruments, particularly in jurisdictions where such activity would be unlawful.
All content is of a general nature and may not address the specific circumstances of any individual or entity. It is not a substitute for professional advice or services. Any actions you take based on the information provided here are strictly at your own risk. You accept full responsibility for any decisions or outcomes arising from your use of this website and agree to release us from any liability in connection with your use of, or reliance upon, the content or products found herein.