
|
IFLYTEK CO., LTD (002230.SZ) Avaliação DCF |
Totalmente Editável: Adapte-Se Às Suas Necessidades No Excel Ou Planilhas
Design Profissional: Modelos Confiáveis E Padrão Da Indústria
Pré-Construídos Para Uso Rápido E Eficiente
Compatível com MAC/PC, totalmente desbloqueado
Não É Necessária Experiência; Fácil De Seguir
iFLYTEK CO.,LTD (002230.SZ) Bundle
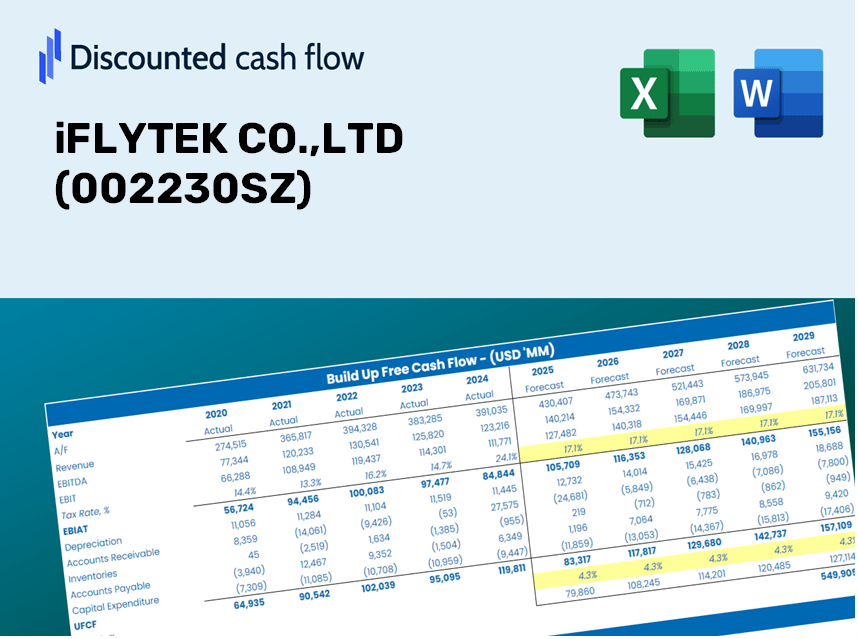
Aprimore suas estratégias de investimento com a calculadora DCF IFLYTEK CO., LTD (002230SZ)! Utilize dados financeiros reais, ajuste as projeções e despesas de crescimento e observe instantaneamente como essas alterações afetam o valor intrínseco de Iflytek co., Ltd (002230SZ).
Discounted Cash Flow (DCF) - (USD MM)
| Year | AY1 2020 |
AY2 2021 |
AY3 2022 |
AY4 2023 |
AY5 2024 |
FY1 2025 |
FY2 2026 |
FY3 2027 |
FY4 2028 |
FY5 2029 |
|---|---|---|---|---|---|---|---|---|---|---|
| Revenue | 13,024.7 | 18,313.6 | 18,820.2 | 19,650.3 | 23,343.1 | 27,228.4 | 31,760.3 | 37,046.5 | 43,212.6 | 50,405.0 |
| Revenue Growth, % | 0 | 40.61 | 2.77 | 4.41 | 18.79 | 16.64 | 16.64 | 16.64 | 16.64 | 16.64 |
| EBITDA | 1,944.0 | 2,203.4 | 1,555.5 | 1,882.6 | 1,037.0 | 2,681.7 | 3,128.1 | 3,648.7 | 4,256.0 | 4,964.4 |
| EBITDA, % | 14.93 | 12.03 | 8.27 | 9.58 | 4.44 | 9.85 | 9.85 | 9.85 | 9.85 | 9.85 |
| Depreciation | 1,182.2 | 1,362.6 | 1,535.4 | 1,710.5 | 710.3 | 1,983.4 | 2,313.6 | 2,698.6 | 3,147.8 | 3,671.7 |
| Depreciation, % | 9.08 | 7.44 | 8.16 | 8.7 | 3.04 | 7.28 | 7.28 | 7.28 | 7.28 | 7.28 |
| EBIT | 761.8 | 840.8 | 20.1 | 172.2 | 326.7 | 698.3 | 814.5 | 950.1 | 1,108.2 | 1,292.7 |
| EBIT, % | 5.85 | 4.59 | 0.10688 | 0.87609 | 1.4 | 2.56 | 2.56 | 2.56 | 2.56 | 2.56 |
| Total Cash | 5,350.0 | 5,869.9 | 4,346.4 | 3,562.6 | 3,387.4 | 7,017.5 | 8,185.5 | 9,547.9 | 11,137.1 | 12,990.8 |
| Total Cash, percent | .0 | .0 | .0 | .0 | .0 | .0 | .0 | .0 | .0 | .0 |
| Account Receivables | 6,988.6 | 9,844.2 | 11,722.3 | 13,522.1 | 16,361.0 | 16,805.3 | 19,602.4 | 22,865.0 | 26,670.7 | 31,109.8 |
| Account Receivables, % | 53.66 | 53.75 | 62.29 | 68.81 | 70.09 | 61.72 | 61.72 | 61.72 | 61.72 | 61.72 |
| Inventories | 2,378.9 | 2,434.0 | 2,729.1 | 2,459.0 | 2,846.5 | 3,853.6 | 4,495.0 | 5,243.1 | 6,115.8 | 7,133.7 |
| Inventories, % | 18.26 | 13.29 | 14.5 | 12.51 | 12.19 | 14.15 | 14.15 | 14.15 | 14.15 | 14.15 |
| Accounts Payable | 5,234.5 | 6,378.5 | 7,492.6 | 7,876.8 | 9,067.3 | 10,551.4 | 12,307.6 | 14,356.1 | 16,745.6 | 19,532.7 |
| Accounts Payable, % | 40.19 | 34.83 | 39.81 | 40.08 | 38.84 | 38.75 | 38.75 | 38.75 | 38.75 | 38.75 |
| Capital Expenditure | -1,249.4 | -2,081.9 | -2,268.1 | -4,081.9 | -3,220.0 | -3,680.1 | -4,292.6 | -5,007.1 | -5,840.5 | -6,812.6 |
| Capital Expenditure, % | -9.59 | -11.37 | -12.05 | -20.77 | -13.79 | -13.52 | -13.52 | -13.52 | -13.52 | -13.52 |
| Tax Rate, % | -144.51 | -144.51 | -144.51 | -144.51 | -144.51 | -144.51 | -144.51 | -144.51 | -144.51 | -144.51 |
| EBITAT | 713.3 | 874.4 | 45.6 | 269.6 | 798.8 | 689.4 | 804.1 | 938.0 | 1,094.1 | 1,276.2 |
| Depreciation | ||||||||||
| Changes in Account Receivables | ||||||||||
| Changes in Inventories | ||||||||||
| Changes in Accounts Payable | ||||||||||
| Capital Expenditure | ||||||||||
| UFCF | -3,487.0 | -1,611.6 | -1,746.4 | -3,247.2 | -3,746.8 | -974.5 | -2,857.2 | -3,332.8 | -3,887.5 | -4,534.6 |
| WACC, % | 7.01 | 7.02 | 7.02 | 7.02 | 7.02 | 7.02 | 7.02 | 7.02 | 7.02 | 7.02 |
| PV UFCF | ||||||||||
| SUM PV UFCF | -12,319.2 | |||||||||
| Long Term Growth Rate, % | 2.00 | |||||||||
| Free cash flow (T + 1) | -4,625 | |||||||||
| Terminal Value | -92,197 | |||||||||
| Present Terminal Value | -65,684 | |||||||||
| Enterprise Value | -78,003 | |||||||||
| Net Debt | 1,960 | |||||||||
| Equity Value | -79,963 | |||||||||
| Diluted Shares Outstanding, MM | 2,334 | |||||||||
| Equity Value Per Share | -34.26 |
What You Will Receive
- Customizable Excel Template: A fully adjustable Excel-based DCF Calculator featuring pre-filled real financial data for iFLYTEK CO.,LTD (002230SZ).
- Actual Data Insights: Access to historical performance data and forward-looking projections (highlighted in the yellow cells).
- Flexible Forecasting: Modify key assumptions such as revenue growth, EBITDA margins, and WACC.
- Instant Calculations: Immediately observe how your input adjustments affect iFLYTEK's valuation.
- Professional-Grade Tool: Designed for investors, CFOs, consultants, and financial analysts.
- Intuitive Design: Organized for clarity and user-friendliness, complete with step-by-step guidance.
Key Features
- 🔍 Real-Life iFLYTEK Financials: Pre-populated historical and forecasted data for iFLYTEK CO.,LTD (002230SZ).
- ✏️ Fully Customizable Inputs: Modify all essential parameters (yellow cells) such as WACC, growth %, and tax rates.
- 📊 Professional DCF Valuation: Integrated formulas assess iFLYTEK’s intrinsic value utilizing the Discounted Cash Flow method.
- ⚡ Instant Results: View iFLYTEK’s valuation in real-time after making adjustments.
- Scenario Analysis: Evaluate and compare results for different financial assumptions side-by-side.
How It Functions
- Step 1: Download the Excel spreadsheet.
- Step 2: Examine iFLYTEK CO., LTD's pre-filled financial information and projections.
- Step 3: Adjust key inputs such as revenue growth, WACC, and tax rates (the highlighted cells).
- Step 4: Observe the DCF model update in real-time as you modify the assumptions.
- Step 5: Evaluate the results and utilize them for your investment strategies.
Why Choose This iFLYTEK Calculator?
- Accurate Data: Real iFLYTEK financials deliver dependable valuation outcomes.
- Customizable: Modify essential parameters such as growth rates, WACC, and tax rates to align with your forecasts.
- Time-Saving: Built-in calculations save you from starting with a blank slate.
- Professional-Grade Tool: Tailored for investors, analysts, and consultants working with iFLYTEK ([002230SZ]).
- User-Friendly: An intuitive design and guided instructions make it accessible for all users.
Who Should Use This Product?
- Individual Investors: Gain insights to make informed decisions when trading iFLYTEK CO.,LTD (002230SZ) stocks.
- Financial Analysts: Enhance your valuation workflows with pre-built financial models tailored for iFLYTEK CO.,LTD (002230SZ).
- Consultants: Provide swift and accurate valuation analyses of iFLYTEK CO.,LTD (002230SZ) to your clients.
- Business Owners: Learn how tech companies like iFLYTEK CO.,LTD (002230SZ) are valued to refine your own business strategies.
- Finance Students: Acquire practical valuation skills using data and scenarios from iFLYTEK CO.,LTD (002230SZ).
What the Template Includes
- Pre-Filled Data: Contains iFLYTEK CO.,LTD's historical financial performance and future projections.
- Discounted Cash Flow Model: An editable DCF valuation model that performs automatic calculations.
- Weighted Average Cost of Capital (WACC): A dedicated worksheet for computing WACC using tailored inputs.
- Key Financial Ratios: Assess iFLYTEK's profitability, operational efficiency, and financial leverage.
- Customizable Inputs: Easily modify revenue growth rates, profit margins, and tax rates.
- Clear Dashboard: Visual representations such as charts and tables that highlight essential valuation outcomes.
Disclaimer
All information, articles, and product details provided on this website are for general informational and educational purposes only. We do not claim any ownership over, nor do we intend to infringe upon, any trademarks, copyrights, logos, brand names, or other intellectual property mentioned or depicted on this site. Such intellectual property remains the property of its respective owners, and any references here are made solely for identification or informational purposes, without implying any affiliation, endorsement, or partnership.
We make no representations or warranties, express or implied, regarding the accuracy, completeness, or suitability of any content or products presented. Nothing on this website should be construed as legal, tax, investment, financial, medical, or other professional advice. In addition, no part of this site—including articles or product references—constitutes a solicitation, recommendation, endorsement, advertisement, or offer to buy or sell any securities, franchises, or other financial instruments, particularly in jurisdictions where such activity would be unlawful.
All content is of a general nature and may not address the specific circumstances of any individual or entity. It is not a substitute for professional advice or services. Any actions you take based on the information provided here are strictly at your own risk. You accept full responsibility for any decisions or outcomes arising from your use of this website and agree to release us from any liability in connection with your use of, or reliance upon, the content or products found herein.