
|
Chengxin Lithium Group Co., Ltd. (002240.sz) Avaliação DCF |
Totalmente Editável: Adapte-Se Às Suas Necessidades No Excel Ou Planilhas
Design Profissional: Modelos Confiáveis E Padrão Da Indústria
Pré-Construídos Para Uso Rápido E Eficiente
Compatível com MAC/PC, totalmente desbloqueado
Não É Necessária Experiência; Fácil De Seguir
Chengxin Lithium Group Co., Ltd. (002240.SZ) Bundle
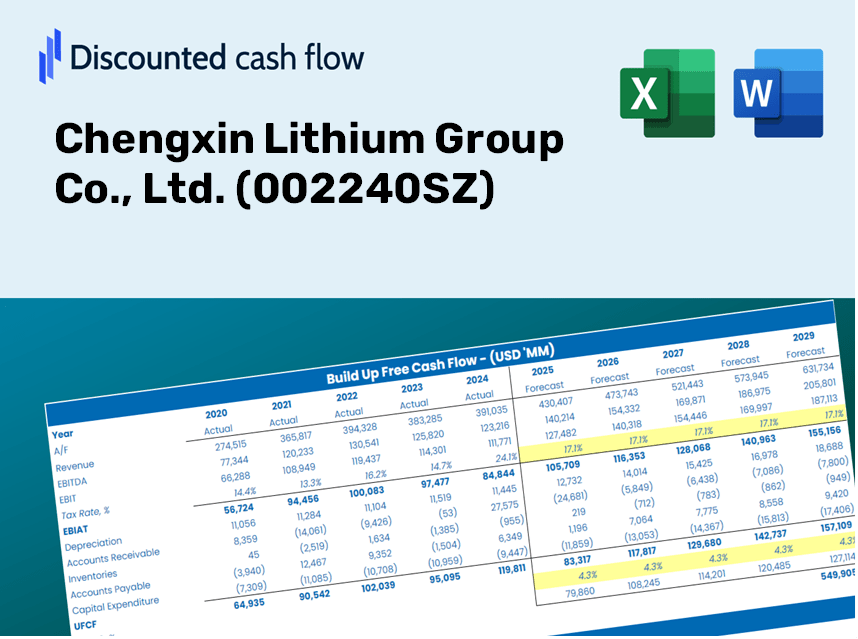
Eleve suas estratégias de investimento com a calculadora DCF do Chengxin Lithium Group Co., Ltd. (002240SZ)! Explore dados financeiros reais, ajuste as projeções e despesas de crescimento e observe instantaneamente como essas modificações afetam o valor intrínseco do Chengxin Lithium Group Co., Ltd. (002240SZ).
Discounted Cash Flow (DCF) - (USD MM)
| Year | AY1 2020 |
AY2 2021 |
AY3 2022 |
AY4 2023 |
AY5 2024 |
FY1 2025 |
FY2 2026 |
FY3 2027 |
FY4 2028 |
FY5 2029 |
|---|---|---|---|---|---|---|---|---|---|---|
| Revenue | 1,790.5 | 3,017.2 | 12,039.2 | 7,951.1 | 4,581.4 | 5,637.1 | 6,936.1 | 8,534.3 | 10,500.9 | 12,920.6 |
| Revenue Growth, % | 0 | 68.51 | 299.03 | -33.96 | -42.38 | 23.04 | 23.04 | 23.04 | 23.04 | 23.04 |
| EBITDA | 1.1 | 1,261.5 | 6,869.2 | 566.9 | -220.5 | 1,141.4 | 1,404.5 | 1,728.1 | 2,126.3 | 2,616.2 |
| EBITDA, % | 0.05934633 | 41.81 | 57.06 | 7.13 | -4.81 | 20.25 | 20.25 | 20.25 | 20.25 | 20.25 |
| Depreciation | 144.0 | 103.2 | 172.1 | 321.9 | 457.8 | 303.7 | 373.6 | 459.7 | 565.6 | 696.0 |
| Depreciation, % | 8.04 | 3.42 | 1.43 | 4.05 | 9.99 | 5.39 | 5.39 | 5.39 | 5.39 | 5.39 |
| EBIT | -142.9 | 1,158.3 | 6,697.1 | 245.0 | -678.3 | 837.8 | 1,030.8 | 1,268.4 | 1,560.6 | 1,920.2 |
| EBIT, % | -7.98 | 38.39 | 55.63 | 3.08 | -14.81 | 14.86 | 14.86 | 14.86 | 14.86 | 14.86 |
| Total Cash | 379.4 | 1,152.8 | 6,579.6 | 2,920.3 | 1,819.8 | 2,147.7 | 2,642.6 | 3,251.5 | 4,000.8 | 4,922.7 |
| Total Cash, percent | .0 | .0 | .0 | .0 | .0 | .0 | .0 | .0 | .0 | .0 |
| Account Receivables | 536.4 | 1,309.5 | 2,399.3 | 941.0 | 556.8 | 1,322.2 | 1,626.9 | 2,001.8 | 2,463.1 | 3,030.6 |
| Account Receivables, % | 29.96 | 43.4 | 19.93 | 11.84 | 12.15 | 23.46 | 23.46 | 23.46 | 23.46 | 23.46 |
| Inventories | 554.9 | 652.9 | 2,742.6 | 2,930.6 | 2,162.0 | 1,797.8 | 2,212.0 | 2,721.7 | 3,348.9 | 4,120.6 |
| Inventories, % | 30.99 | 21.64 | 22.78 | 36.86 | 47.19 | 31.89 | 31.89 | 31.89 | 31.89 | 31.89 |
| Accounts Payable | 327.3 | 408.5 | 550.4 | 1,174.9 | 1,457.5 | 935.5 | 1,151.1 | 1,416.3 | 1,742.7 | 2,144.2 |
| Accounts Payable, % | 18.28 | 13.54 | 4.57 | 14.78 | 31.81 | 16.6 | 16.6 | 16.6 | 16.6 | 16.6 |
| Capital Expenditure | -331.0 | -377.2 | -1,036.5 | -3,421.9 | -2,278.4 | -1,492.3 | -1,836.2 | -2,259.3 | -2,779.9 | -3,420.4 |
| Capital Expenditure, % | -18.49 | -12.5 | -8.61 | -43.04 | -49.73 | -26.47 | -26.47 | -26.47 | -26.47 | -26.47 |
| Tax Rate, % | -4.65 | -4.65 | -4.65 | -4.65 | -4.65 | -4.65 | -4.65 | -4.65 | -4.65 | -4.65 |
| EBITAT | -234.6 | 941.2 | 5,519.3 | 226.3 | -709.8 | 764.1 | 940.2 | 1,156.8 | 1,423.4 | 1,751.4 |
| Depreciation | ||||||||||
| Changes in Account Receivables | ||||||||||
| Changes in Inventories | ||||||||||
| Changes in Accounts Payable | ||||||||||
| Capital Expenditure | ||||||||||
| UFCF | -1,185.7 | -122.6 | 1,617.4 | -978.8 | -1,095.1 | -1,347.7 | -1,025.7 | -1,262.1 | -1,552.9 | -1,910.7 |
| WACC, % | 5.69 | 5.49 | 5.5 | 5.6 | 5.69 | 5.59 | 5.59 | 5.59 | 5.59 | 5.59 |
| PV UFCF | ||||||||||
| SUM PV UFCF | -5,973.1 | |||||||||
| Long Term Growth Rate, % | 0.50 | |||||||||
| Free cash flow (T + 1) | -1,920 | |||||||||
| Terminal Value | -37,711 | |||||||||
| Present Terminal Value | -28,728 | |||||||||
| Enterprise Value | -34,702 | |||||||||
| Net Debt | 3,921 | |||||||||
| Equity Value | -38,623 | |||||||||
| Diluted Shares Outstanding, MM | 901 | |||||||||
| Equity Value Per Share | -42.87 |
Benefits You Will Receive
- Pre-Loaded Financial Model: Utilize Chengxin Lithium Group's actual data for accurate DCF valuation.
- Comprehensive Forecast Control: Modify revenue growth, profit margins, WACC, and other critical factors.
- Real-Time Calculations: Automatic updates let you view results instantly as you adjust parameters.
- Professional-Grade Template: A polished Excel file crafted for high-quality valuation.
- Flexible and Reusable: Designed for versatility, enabling repeated use for in-depth forecasts.
Key Features
- Customizable Projection Inputs: Adjust essential factors such as lithium production growth, profit margins, and capital investments.
- Instant DCF Valuation: Quickly computes intrinsic value, net present value, and other crucial financial metrics.
- High-Precision Accuracy: Leverages Chengxin Lithium Group's real-world financial data for precise valuation results.
- Effortless Scenario Analysis: Easily experiment with various assumptions and assess different outcomes.
- Efficiency Booster: Streamlines the valuation process, eliminating the need for complex model development from square one.
How It Functions
- Step 1: Download the prebuilt Excel template containing Chengxin Lithium Group Co., Ltd.'s (002240SZ) data.
- Step 2: Navigate through the pre-filled sheets to familiarize yourself with the key performance metrics.
- Step 3: Modify forecasts and assumptions in the editable yellow cells (WACC, growth rate, margins).
- Step 4: Instantly see the recalculated results, highlighting the intrinsic value of Chengxin Lithium Group Co., Ltd. (002240SZ).
- Step 5: Utilize the outputs to make informed investment choices or to create comprehensive reports.
Why Opt for This Calculator?
- Designed for Experts: A specialized tool utilized by analysts, CFOs, and industry consultants.
- Accurate Historical Data: Chengxin Lithium Group's historical and projected financials are preloaded for precision.
- Flexible Scenario Analysis: Effortlessly simulate various forecasts and assumptions.
- Comprehensive Outputs: Instantly calculates intrinsic value, NPV, and essential metrics.
- User-Friendly: Step-by-step guidance simplifies the entire process.
Who Can Benefit from Chengxin Lithium Group Co., Ltd. (002240SZ)?
- Investors: Make informed investment choices with our advanced analysis tools.
- Financial Analysts: Enhance efficiency with a customizable DCF model tailored for lithium market assessments.
- Consultants: Seamlessly modify templates for impactful client presentations and detailed reports.
- Finance Enthusiasts: Expand your knowledge of valuation methods with practical, industry-specific examples.
- Educators and Students: Utilize this resource as a hands-on learning aid in finance and investment courses.
Contents of the Template
- Historical Data: Provides an overview of Chengxin Lithium Group Co., Ltd.'s past financial performance and baseline predictions.
- DCF and Levered DCF Models: Comprehensive templates for calculating the intrinsic value of Chengxin Lithium Group Co., Ltd. (002240SZ).
- WACC Sheet: Pre-configured calculations for the Weighted Average Cost of Capital.
- Editable Inputs: Adjust critical parameters such as growth rates, EBITDA margins, and CAPEX forecasts.
- Quarterly and Annual Statements: A thorough analysis of Chengxin Lithium Group Co., Ltd.'s financial data.
- Interactive Dashboard: Visualize valuation outcomes and projections in an engaging format.
Disclaimer
All information, articles, and product details provided on this website are for general informational and educational purposes only. We do not claim any ownership over, nor do we intend to infringe upon, any trademarks, copyrights, logos, brand names, or other intellectual property mentioned or depicted on this site. Such intellectual property remains the property of its respective owners, and any references here are made solely for identification or informational purposes, without implying any affiliation, endorsement, or partnership.
We make no representations or warranties, express or implied, regarding the accuracy, completeness, or suitability of any content or products presented. Nothing on this website should be construed as legal, tax, investment, financial, medical, or other professional advice. In addition, no part of this site—including articles or product references—constitutes a solicitation, recommendation, endorsement, advertisement, or offer to buy or sell any securities, franchises, or other financial instruments, particularly in jurisdictions where such activity would be unlawful.
All content is of a general nature and may not address the specific circumstances of any individual or entity. It is not a substitute for professional advice or services. Any actions you take based on the information provided here are strictly at your own risk. You accept full responsibility for any decisions or outcomes arising from your use of this website and agree to release us from any liability in connection with your use of, or reliance upon, the content or products found herein.