
|
Zhejiang Wanma Co., Ltd. (002276.sz) Avaliação DCF |
Totalmente Editável: Adapte-Se Às Suas Necessidades No Excel Ou Planilhas
Design Profissional: Modelos Confiáveis E Padrão Da Indústria
Pré-Construídos Para Uso Rápido E Eficiente
Compatível com MAC/PC, totalmente desbloqueado
Não É Necessária Experiência; Fácil De Seguir
Zhejiang Wanma Co., Ltd. (002276.SZ) Bundle
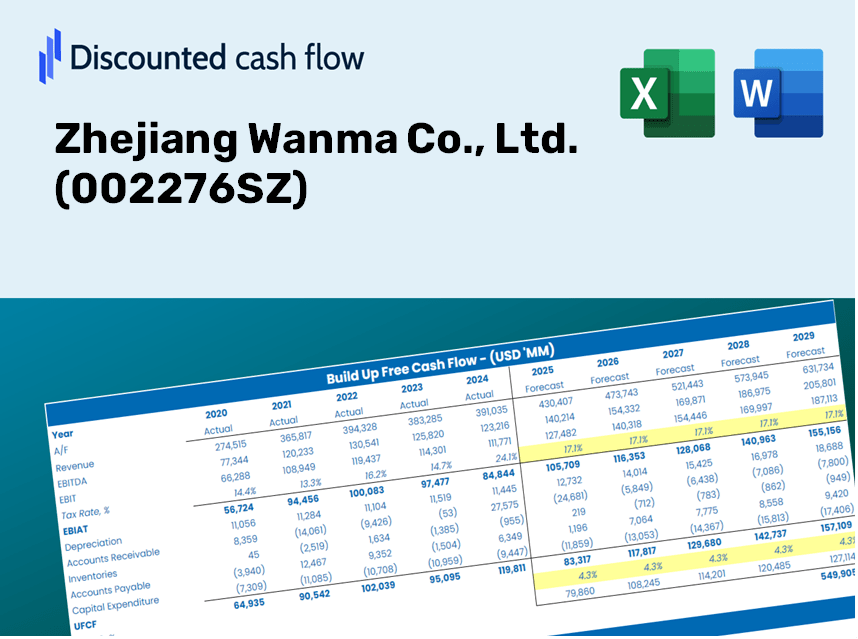
Aprimore suas opções de investimento com a calculadora DCF da Zhejiang Wanma Co., Ltd. (002276SZ)! Revise os dados financeiros mais recentes, ajuste as projeções e despesas de crescimento e observe instantaneamente como essas modificações afetam o valor intrínseco da Zhejiang Wanma Co., Ltd. (002276SZ).
Discounted Cash Flow (DCF) - (USD MM)
| Year | AY1 2020 |
AY2 2021 |
AY3 2022 |
AY4 2023 |
AY5 2024 |
FY1 2025 |
FY2 2026 |
FY3 2027 |
FY4 2028 |
FY5 2029 |
|---|---|---|---|---|---|---|---|---|---|---|
| Revenue | 9,321.8 | 12,767.5 | 14,675.0 | 15,121.0 | 17,760.7 | 17,976.5 | 18,194.9 | 18,416.0 | 18,639.8 | 18,866.3 |
| Revenue Growth, % | 0 | 36.96 | 14.94 | 3.04 | 17.46 | 1.22 | 1.22 | 1.22 | 1.22 | 1.22 |
| EBITDA | 465.3 | 511.8 | 666.9 | 785.5 | 647.1 | 804.7 | 814.5 | 824.4 | 834.4 | 844.6 |
| EBITDA, % | 4.99 | 4.01 | 4.54 | 5.19 | 3.64 | 4.48 | 4.48 | 4.48 | 4.48 | 4.48 |
| Depreciation | 159.1 | 174.4 | 190.2 | 211.9 | 226.0 | 253.2 | 256.3 | 259.4 | 262.5 | 265.7 |
| Depreciation, % | 1.71 | 1.37 | 1.3 | 1.4 | 1.27 | 1.41 | 1.41 | 1.41 | 1.41 | 1.41 |
| EBIT | 306.3 | 337.4 | 476.7 | 573.5 | 421.1 | 551.5 | 558.2 | 565.0 | 571.9 | 578.8 |
| EBIT, % | 3.29 | 2.64 | 3.25 | 3.79 | 2.37 | 3.07 | 3.07 | 3.07 | 3.07 | 3.07 |
| Total Cash | 1,514.8 | 2,556.4 | 3,631.1 | 3,468.9 | 2,404.2 | 3,505.2 | 3,547.8 | 3,590.9 | 3,634.5 | 3,678.7 |
| Total Cash, percent | .0 | .0 | .0 | .0 | .0 | .0 | .0 | .0 | .0 | .0 |
| Account Receivables | 3,717.7 | 4,863.6 | 4,976.6 | 5,740.7 | 7,386.6 | 6,882.9 | 6,966.5 | 7,051.2 | 7,136.9 | 7,223.6 |
| Account Receivables, % | 39.88 | 38.09 | 33.91 | 37.97 | 41.59 | 38.29 | 38.29 | 38.29 | 38.29 | 38.29 |
| Inventories | 784.0 | 995.8 | 858.0 | 1,203.3 | 1,335.0 | 1,349.4 | 1,365.8 | 1,382.4 | 1,399.2 | 1,416.2 |
| Inventories, % | 8.41 | 7.8 | 5.85 | 7.96 | 7.52 | 7.51 | 7.51 | 7.51 | 7.51 | 7.51 |
| Accounts Payable | 2,521.5 | 4,644.3 | 4,929.1 | 5,452.4 | 6,751.2 | 6,151.0 | 6,225.7 | 6,301.4 | 6,378.0 | 6,455.5 |
| Accounts Payable, % | 27.05 | 36.38 | 33.59 | 36.06 | 38.01 | 34.22 | 34.22 | 34.22 | 34.22 | 34.22 |
| Capital Expenditure | -268.5 | -372.9 | -313.7 | -525.9 | -409.6 | -493.3 | -499.3 | -505.4 | -511.5 | -517.8 |
| Capital Expenditure, % | -2.88 | -2.92 | -2.14 | -3.48 | -2.31 | -2.74 | -2.74 | -2.74 | -2.74 | -2.74 |
| Tax Rate, % | 7.99 | 7.99 | 7.99 | 7.99 | 7.99 | 7.99 | 7.99 | 7.99 | 7.99 | 7.99 |
| EBITAT | 275.1 | 317.4 | 438.4 | 526.8 | 387.4 | 507.1 | 513.3 | 519.5 | 525.8 | 532.2 |
| Depreciation | ||||||||||
| Changes in Account Receivables | ||||||||||
| Changes in Inventories | ||||||||||
| Changes in Accounts Payable | ||||||||||
| Capital Expenditure | ||||||||||
| UFCF | -1,814.5 | 884.1 | 624.4 | -373.2 | -274.9 | 156.1 | 244.9 | 247.9 | 250.9 | 253.9 |
| WACC, % | 4.91 | 4.94 | 4.93 | 4.93 | 4.93 | 4.93 | 4.93 | 4.93 | 4.93 | 4.93 |
| PV UFCF | ||||||||||
| SUM PV UFCF | 992.4 | |||||||||
| Long Term Growth Rate, % | 3.50 | |||||||||
| Free cash flow (T + 1) | 263 | |||||||||
| Terminal Value | 18,421 | |||||||||
| Present Terminal Value | 14,484 | |||||||||
| Enterprise Value | 15,477 | |||||||||
| Net Debt | -1,394 | |||||||||
| Equity Value | 16,870 | |||||||||
| Diluted Shares Outstanding, MM | 995 | |||||||||
| Equity Value Per Share | 16.95 |
Your Benefits
- Authentic 002276SZ Financial Data: Comes preloaded with Zhejiang Wanma's historical and projected figures for accurate analysis.
- Completely Customizable Template: Easily adjust key metrics such as revenue growth, WACC, and EBITDA percentage.
- Instant Calculations: Observe the immediate updates of Zhejiang Wanma’s intrinsic value as you modify inputs.
- Professional Valuation Resource: Tailored for investors, analysts, and consultants aiming for precise DCF outcomes.
- User-Friendly Layout: An intuitive design with straightforward instructions suitable for all levels of expertise.
Key Features
- 🔍 Real-Life (002276SZ) Financials: Pre-filled historical and projected data for Zhejiang Wanma Co., Ltd.
- ✏️ Fully Customizable Inputs: Adjust all critical parameters (yellow cells) such as WACC, growth %, and tax rates.
- 📊 Professional DCF Valuation: Built-in formulas to determine the intrinsic value of Zhejiang Wanma using the Discounted Cash Flow method.
- ⚡ Instant Results: Visualize the valuation of Zhejiang Wanma immediately after making any adjustments.
- Scenario Analysis: Evaluate and compare various financial assumptions side-by-side for enhanced decision-making.
How It Operates
- 1. Access the Template: Download and open the Excel sheet featuring Zhejiang Wanma Co., Ltd.'s (002276SZ) included data.
- 2. Modify Assumptions: Adjust essential inputs such as growth rates, WACC, and capital expenditures.
- 3. Observe Results Immediately: The DCF model automatically computes intrinsic value and NPV.
- 4. Explore Various Scenarios: Evaluate multiple forecasts to assess different valuation results.
- 5. Utilize with Assurance: Deliver professional valuation insights to bolster your decision-making process.
Why Opt for Zhejiang Wanma Co., Ltd. Calculator?
- Precision: Utilizes authentic financial data for reliable results.
- Versatility: Tailored for users to easily experiment and adjust parameters.
- Efficiency: Avoid the complexities of constructing a DCF model independently.
- High-Quality Standards: Crafted with the expertise and attention to detail expected from top financial professionals.
- Intuitive Design: Simple interface that accommodates users of all financial backgrounds.
Who Can Benefit from This Product?
- Investors: Evaluate Zhejiang Wanma Co., Ltd.'s (002276SZ) market position before making investment decisions.
- CFOs and Financial Analysts: Enhance the efficiency of valuation methods and assess financial forecasts.
- Startup Founders: Gain insights into the valuation practices of established companies like Zhejiang Wanma Co., Ltd. (002276SZ).
- Consultants: Create comprehensive valuation reports tailored for your clients.
- Students and Educators: Utilize current data to teach and apply valuation methodologies effectively.
What the Template Contains
- Historical Data: Includes Zhejiang Wanma Co., Ltd.'s past financials and baseline forecasts.
- DCF and Levered DCF Models: Comprehensive templates for calculating the intrinsic value of Zhejiang Wanma Co., Ltd. (002276SZ).
- WACC Sheet: Pre-constructed calculations for the Weighted Average Cost of Capital.
- Editable Inputs: Customize key drivers such as growth rates, EBITDA %, and CAPEX assumptions.
- Quarterly and Annual Statements: A thorough breakdown of Zhejiang Wanma Co., Ltd.'s financials.
- Interactive Dashboard: Dynamic visualization of valuation results and projections.
Disclaimer
All information, articles, and product details provided on this website are for general informational and educational purposes only. We do not claim any ownership over, nor do we intend to infringe upon, any trademarks, copyrights, logos, brand names, or other intellectual property mentioned or depicted on this site. Such intellectual property remains the property of its respective owners, and any references here are made solely for identification or informational purposes, without implying any affiliation, endorsement, or partnership.
We make no representations or warranties, express or implied, regarding the accuracy, completeness, or suitability of any content or products presented. Nothing on this website should be construed as legal, tax, investment, financial, medical, or other professional advice. In addition, no part of this site—including articles or product references—constitutes a solicitation, recommendation, endorsement, advertisement, or offer to buy or sell any securities, franchises, or other financial instruments, particularly in jurisdictions where such activity would be unlawful.
All content is of a general nature and may not address the specific circumstances of any individual or entity. It is not a substitute for professional advice or services. Any actions you take based on the information provided here are strictly at your own risk. You accept full responsibility for any decisions or outcomes arising from your use of this website and agree to release us from any liability in connection with your use of, or reliance upon, the content or products found herein.