
|
Pequim Join-Cheer Software Co., Ltd. (002279.SZ) Avaliação DCF |
Totalmente Editável: Adapte-Se Às Suas Necessidades No Excel Ou Planilhas
Design Profissional: Modelos Confiáveis E Padrão Da Indústria
Pré-Construídos Para Uso Rápido E Eficiente
Compatível com MAC/PC, totalmente desbloqueado
Não É Necessária Experiência; Fácil De Seguir
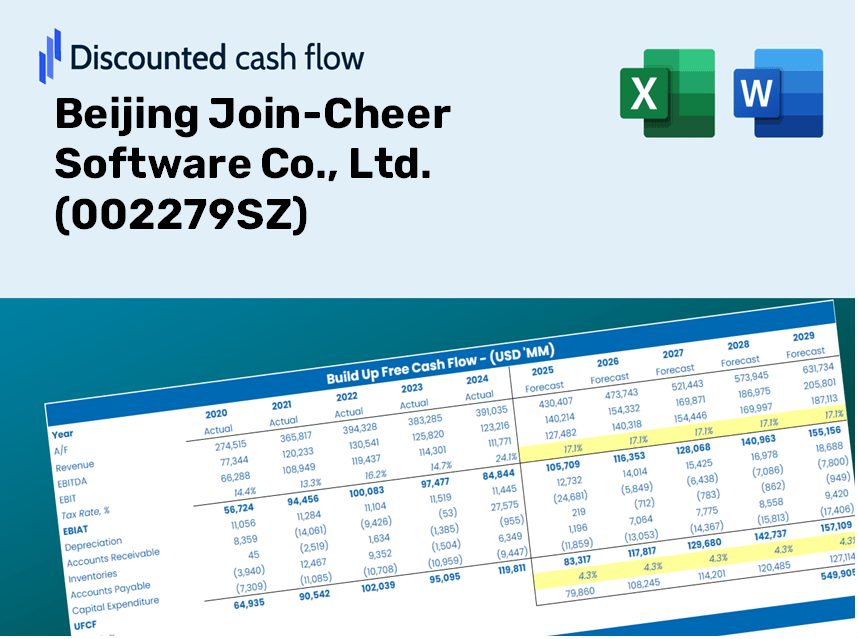
Beijing Join-Cheer Software Co., Ltd. (002279.SZ) Bundle
Seja você um investidor ou analista, esta calculadora DCF (002279SZ) é o seu recurso preferido para uma avaliação precisa. Carregado com dados reais da Pequim Join-Cheer Software Co., Ltd., você pode ajustar as previsões e observar os efeitos em tempo real.
Discounted Cash Flow (DCF) - (USD MM)
| Year | AY1 2020 |
AY2 2021 |
AY3 2022 |
AY4 2023 |
AY5 2024 |
FY1 2025 |
FY2 2026 |
FY3 2027 |
FY4 2028 |
FY5 2029 |
|---|---|---|---|---|---|---|---|---|---|---|
| Revenue | 2,821.4 | 2,708.6 | 2,897.8 | 3,411.7 | 4,037.2 | 4,431.3 | 4,864.0 | 5,338.9 | 5,860.2 | 6,432.3 |
| Revenue Growth, % | 0 | -4 | 6.99 | 17.73 | 18.33 | 9.76 | 9.76 | 9.76 | 9.76 | 9.76 |
| EBITDA | 153.2 | -48.5 | 136.1 | -104.9 | -111.7 | 22.1 | 24.3 | 26.6 | 29.2 | 32.1 |
| EBITDA, % | 5.43 | -1.79 | 4.7 | -3.07 | -2.77 | 0.49906 | 0.49906 | 0.49906 | 0.49906 | 0.49906 |
| Depreciation | 35.5 | 41.7 | 39.7 | 37.9 | 36.9 | 54.9 | 60.3 | 66.1 | 72.6 | 79.7 |
| Depreciation, % | 1.26 | 1.54 | 1.37 | 1.11 | 0.9148 | 1.24 | 1.24 | 1.24 | 1.24 | 1.24 |
| EBIT | 117.7 | -90.2 | 96.4 | -142.8 | -148.6 | -32.8 | -36.0 | -39.5 | -43.3 | -47.6 |
| EBIT, % | 4.17 | -3.33 | 3.33 | -4.19 | -3.68 | -0.73972 | -0.73972 | -0.73972 | -0.73972 | -0.73972 |
| Total Cash | 858.4 | 1,023.8 | 1,170.9 | 1,214.3 | 1,026.3 | 1,503.5 | 1,650.3 | 1,811.4 | 1,988.3 | 2,182.4 |
| Total Cash, percent | .0 | .0 | .0 | .0 | .0 | .0 | .0 | .0 | .0 | .0 |
| Account Receivables | 507.1 | 527.2 | 578.7 | 804.7 | 722.7 | 876.5 | 962.1 | 1,056.0 | 1,159.1 | 1,272.3 |
| Account Receivables, % | 17.97 | 19.46 | 19.97 | 23.59 | 17.9 | 19.78 | 19.78 | 19.78 | 19.78 | 19.78 |
| Inventories | 112.9 | 95.4 | 58.5 | 41.5 | 37.4 | 103.6 | 113.7 | 124.8 | 137.0 | 150.3 |
| Inventories, % | 4 | 3.52 | 2.02 | 1.22 | 0.92708 | 2.34 | 2.34 | 2.34 | 2.34 | 2.34 |
| Accounts Payable | 200.3 | 171.3 | 250.5 | 566.7 | 525.6 | 458.2 | 502.9 | 552.0 | 605.9 | 665.1 |
| Accounts Payable, % | 7.1 | 6.33 | 8.64 | 16.61 | 13.02 | 10.34 | 10.34 | 10.34 | 10.34 | 10.34 |
| Capital Expenditure | -28.8 | -26.5 | -35.1 | -48.6 | -62.0 | -54.7 | -60.0 | -65.9 | -72.3 | -79.4 |
| Capital Expenditure, % | -1.02 | -0.97919 | -1.21 | -1.42 | -1.54 | -1.23 | -1.23 | -1.23 | -1.23 | -1.23 |
| Tax Rate, % | -1.86 | -1.86 | -1.86 | -1.86 | -1.86 | -1.86 | -1.86 | -1.86 | -1.86 | -1.86 |
| EBITAT | 115.6 | -89.2 | 87.7 | -139.6 | -151.4 | -31.8 | -35.0 | -38.4 | -42.1 | -46.2 |
| Depreciation | ||||||||||
| Changes in Account Receivables | ||||||||||
| Changes in Inventories | ||||||||||
| Changes in Accounts Payable | ||||||||||
| Capital Expenditure | ||||||||||
| UFCF | -297.4 | -105.6 | 156.9 | -43.1 | -131.5 | -319.0 | -85.7 | -94.1 | -103.2 | -113.3 |
| WACC, % | 4.58 | 4.58 | 4.57 | 4.58 | 4.58 | 4.58 | 4.58 | 4.58 | 4.58 | 4.58 |
| PV UFCF | ||||||||||
| SUM PV UFCF | -642.6 | |||||||||
| Long Term Growth Rate, % | 3.50 | |||||||||
| Free cash flow (T + 1) | -117 | |||||||||
| Terminal Value | -10,907 | |||||||||
| Present Terminal Value | -8,721 | |||||||||
| Enterprise Value | -9,363 | |||||||||
| Net Debt | -423 | |||||||||
| Equity Value | -8,940 | |||||||||
| Diluted Shares Outstanding, MM | 865 | |||||||||
| Equity Value Per Share | -10.33 |
Benefits of Choosing Us
- Adjustable Forecast Parameters: Effortlessly modify assumptions (growth %, profit margins, discount rates) to explore various scenarios.
- Comprehensive Data Insights: Pre-loaded financial metrics for Beijing Join-Cheer Software Co., Ltd. (002279SZ) to enhance your analysis.
- Instant DCF Calculations: The template automatically computes Net Present Value (NPV) and intrinsic value.
- Professional and Adaptable: A refined Excel model tailored to meet your valuation requirements.
- Designed for Analysts and Investors: Perfect for evaluating forecasts, verifying strategies, and increasing efficiency.
Key Features
- Accurate Financial Data for Beijing Join-Cheer: Gain access to reliable pre-loaded historical data and future forecasts tailored for [002279SZ].
- Customizable Forecasting Parameters: Modify highlighted cells such as WACC, growth rates, and profit margins to fit your analysis.
- Real-Time Calculations: Automatically refresh DCF, Net Present Value (NPV), and cash flow analyses as inputs change.
- User-Friendly Dashboard: Intuitive charts and summaries to help you quickly understand your valuation insights.
- Suitable for All Skill Levels: Designed with a straightforward layout ideal for investors, CFOs, and consultants alike.
How It Functions
- Download: Obtain the pre-configured Excel file featuring Beijing Join-Cheer Software Co., Ltd.'s (002279SZ) financial data.
- Customize: Modify forecasts such as revenue growth, EBITDA %, and WACC to fit your analysis.
- Update Automatically: Intrinsic value and NPV calculations refresh in real-time as inputs change.
- Test Scenarios: Develop various projections and instantly compare their outcomes.
- Make Decisions: Leverage the valuation findings to inform your investment strategy.
Why Choose This Calculator for Beijing Join-Cheer Software Co., Ltd. (002279SZ)?
- All-in-One Solution: Offers comprehensive analysis including DCF, WACC, and financial ratios all in one tool.
- Flexible Inputs: Modify the yellow-highlighted fields to explore different financial scenarios.
- In-Depth Analysis: Automatically determines the intrinsic value and Net Present Value for Beijing Join-Cheer Software Co., Ltd. (002279SZ).
- Ready-to-Use Data: Contains both historical and projected data for reliable initial evaluations.
- Expert Standard: Perfect for financial analysts, investors, and business advisors.
Who Can Benefit from This Product?
- Individual Investors: Gain insights to make knowledgeable decisions about investing in Beijing Join-Cheer Software Co., Ltd. (002279SZ).
- Financial Analysts: Enhance your valuation methods with efficient, pre-built financial models.
- Consultants: Provide clients with precise and timely valuation analyses.
- Business Owners: Learn how major firms like Beijing Join-Cheer Software Co., Ltd. (002279SZ) are valued to inform your strategic planning.
- Finance Students: Master valuation methods through practical applications using current market data.
Contents of the Template
- Preloaded BJCS Data: Historical and projected financial metrics, such as revenue, EBIT, and capital expenditures.
- DCF and WACC Models: Advanced spreadsheets designed for calculating intrinsic value and the Weighted Average Cost of Capital.
- Editable Inputs: Cells highlighted in yellow for easy adjustments of revenue growth rates, tax rates, and discount rates.
- Financial Statements: Detailed annual and quarterly financials for thorough analysis.
- Key Ratios: Metrics for profitability, leverage, and efficiency to assess company performance.
- Dashboard and Charts: Visual representations of valuation results and underlying assumptions.
Disclaimer
All information, articles, and product details provided on this website are for general informational and educational purposes only. We do not claim any ownership over, nor do we intend to infringe upon, any trademarks, copyrights, logos, brand names, or other intellectual property mentioned or depicted on this site. Such intellectual property remains the property of its respective owners, and any references here are made solely for identification or informational purposes, without implying any affiliation, endorsement, or partnership.
We make no representations or warranties, express or implied, regarding the accuracy, completeness, or suitability of any content or products presented. Nothing on this website should be construed as legal, tax, investment, financial, medical, or other professional advice. In addition, no part of this site—including articles or product references—constitutes a solicitation, recommendation, endorsement, advertisement, or offer to buy or sell any securities, franchises, or other financial instruments, particularly in jurisdictions where such activity would be unlawful.
All content is of a general nature and may not address the specific circumstances of any individual or entity. It is not a substitute for professional advice or services. Any actions you take based on the information provided here are strictly at your own risk. You accept full responsibility for any decisions or outcomes arising from your use of this website and agree to release us from any liability in connection with your use of, or reliance upon, the content or products found herein.