
|
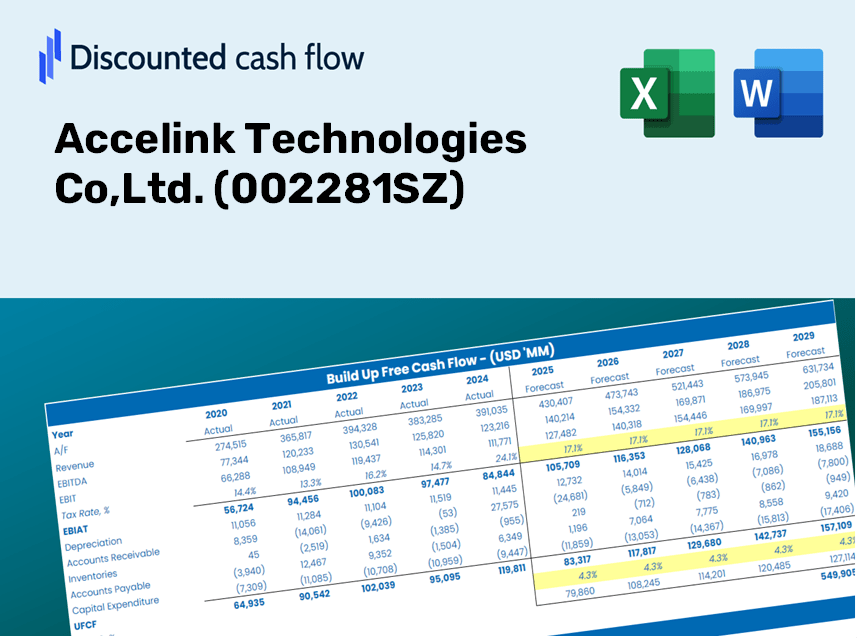
Accelink Technologies Co, Ltd. (002281.sz) Avaliação DCF |
Totalmente Editável: Adapte-Se Às Suas Necessidades No Excel Ou Planilhas
Design Profissional: Modelos Confiáveis E Padrão Da Indústria
Pré-Construídos Para Uso Rápido E Eficiente
Compatível com MAC/PC, totalmente desbloqueado
Não É Necessária Experiência; Fácil De Seguir
Accelink Technologies Co,Ltd. (002281.SZ) Bundle
Aprimore suas estratégias de investimento com a calculadora DCF (002281SZ)! Utilize a Accelink Technologies Co., Ltd. Dados financeiros, ajuste as projeções e despesas de crescimento e observe instantaneamente como esses ajustes afetam o valor intrínseco de (002281SZ).
Discounted Cash Flow (DCF) - (USD MM)
| Year | AY1 2020 |
AY2 2021 |
AY3 2022 |
AY4 2023 |
AY5 2024 |
FY1 2025 |
FY2 2026 |
FY3 2027 |
FY4 2028 |
FY5 2029 |
|---|---|---|---|---|---|---|---|---|---|---|
| Revenue | 6,046.0 | 6,486.3 | 6,911.9 | 6,060.9 | 8,272.3 | 9,058.5 | 9,919.5 | 10,862.3 | 11,894.7 | 13,025.2 |
| Revenue Growth, % | 0 | 7.28 | 6.56 | -12.31 | 36.49 | 9.5 | 9.5 | 9.5 | 9.5 | 9.5 |
| EBITDA | 658.7 | 733.4 | 784.4 | 749.9 | 906.9 | 1,030.6 | 1,128.6 | 1,235.8 | 1,353.3 | 1,481.9 |
| EBITDA, % | 10.89 | 11.31 | 11.35 | 12.37 | 10.96 | 11.38 | 11.38 | 11.38 | 11.38 | 11.38 |
| Depreciation | 214.1 | 264.1 | 294.1 | 294.0 | 283.7 | 365.0 | 399.7 | 437.7 | 479.3 | 524.9 |
| Depreciation, % | 3.54 | 4.07 | 4.26 | 4.85 | 3.43 | 4.03 | 4.03 | 4.03 | 4.03 | 4.03 |
| EBIT | 444.6 | 469.3 | 490.3 | 455.9 | 623.2 | 665.6 | 728.8 | 798.1 | 874.0 | 957.0 |
| EBIT, % | 7.35 | 7.23 | 7.09 | 7.52 | 7.53 | 7.35 | 7.35 | 7.35 | 7.35 | 7.35 |
| Total Cash | 2,488.3 | 2,852.9 | 2,168.1 | 3,735.9 | 3,535.4 | 4,001.7 | 4,382.1 | 4,798.6 | 5,254.7 | 5,754.1 |
| Total Cash, percent | .0 | .0 | .0 | .0 | .0 | .0 | .0 | .0 | .0 | .0 |
| Account Receivables | 2,326.1 | 2,176.9 | 2,189.0 | 2,592.6 | 3,346.0 | 3,386.6 | 3,708.5 | 4,060.9 | 4,446.9 | 4,869.6 |
| Account Receivables, % | 38.47 | 33.56 | 31.67 | 42.78 | 40.45 | 37.39 | 37.39 | 37.39 | 37.39 | 37.39 |
| Inventories | 1,959.1 | 2,200.8 | 2,330.5 | 1,886.3 | 3,955.2 | 3,242.7 | 3,550.9 | 3,888.3 | 4,257.9 | 4,662.6 |
| Inventories, % | 32.4 | 33.93 | 33.72 | 31.12 | 47.81 | 35.8 | 35.8 | 35.8 | 35.8 | 35.8 |
| Accounts Payable | 2,359.7 | 2,232.2 | 2,340.6 | 2,245.6 | 4,045.8 | 3,501.4 | 3,834.2 | 4,198.6 | 4,597.6 | 5,034.6 |
| Accounts Payable, % | 39.03 | 34.41 | 33.86 | 37.05 | 48.91 | 38.65 | 38.65 | 38.65 | 38.65 | 38.65 |
| Capital Expenditure | -235.9 | -346.7 | -428.1 | -670.3 | -706.9 | -635.0 | -695.3 | -761.4 | -833.7 | -913.0 |
| Capital Expenditure, % | -3.9 | -5.35 | -6.19 | -11.06 | -8.55 | -7.01 | -7.01 | -7.01 | -7.01 | -7.01 |
| Tax Rate, % | 8.26 | 8.26 | 8.26 | 8.26 | 8.26 | 8.26 | 8.26 | 8.26 | 8.26 | 8.26 |
| EBITAT | 435.2 | 429.3 | 435.6 | 416.8 | 571.8 | 614.2 | 672.6 | 736.5 | 806.5 | 883.1 |
| Depreciation | ||||||||||
| Changes in Account Receivables | ||||||||||
| Changes in Inventories | ||||||||||
| Changes in Accounts Payable | ||||||||||
| Capital Expenditure | ||||||||||
| UFCF | -1,512.1 | 126.7 | 268.2 | -13.9 | -873.6 | 471.8 | 79.7 | 87.3 | 95.6 | 104.6 |
| WACC, % | 5.52 | 5.52 | 5.52 | 5.52 | 5.52 | 5.52 | 5.52 | 5.52 | 5.52 | 5.52 |
| PV UFCF | ||||||||||
| SUM PV UFCF | 749.9 | |||||||||
| Long Term Growth Rate, % | 3.00 | |||||||||
| Free cash flow (T + 1) | 108 | |||||||||
| Terminal Value | 4,272 | |||||||||
| Present Terminal Value | 3,265 | |||||||||
| Enterprise Value | 4,015 | |||||||||
| Net Debt | -2,746 | |||||||||
| Equity Value | 6,761 | |||||||||
| Diluted Shares Outstanding, MM | 787 | |||||||||
| Equity Value Per Share | 8.59 |
What You Will Receive
- Genuine Accelink Financial Data: Pre-filled with historical and projected data for accurate analysis of Accelink Technologies Co., Ltd. (002281SZ).
- Completely Customizable Template: Easily adjust key inputs such as revenue growth, WACC, and EBITDA percentages.
- Instant Calculations: Witness real-time updates of Accelink’s intrinsic value as you modify inputs.
- Expert Valuation Tool: Tailored for investors, analysts, and consultants pursuing precise DCF results.
- Easy-to-Use Interface: Intuitive layout with straightforward instructions suitable for all skill levels.
Key Features
- Real-Time Accelink Data: Pre-loaded with Accelink Technologies' historical financial performance and future projections.
- Customizable Parameters: Tailor revenue growth, profit margins, discount rates, tax policies, and capital investments to your needs.
- Dynamic Valuation Framework: Instant updates to Net Present Value (NPV) and intrinsic value based on the adjustments you make.
- Scenario Analysis: Develop various forecasting scenarios to explore different valuation possibilities.
- Intuitive Interface: Designed to be straightforward and accessible for both experienced professionals and beginners.
How It Functions
- Step 1: Download the Excel file for Accelink Technologies Co., Ltd. (002281SZ).
- Step 2: Examine the pre-filled data for Accelink (historical and forecasted).
- Step 3: Modify key assumptions (highlighted in yellow) based on your insights.
- Step 4: Observe automatic updates to Accelink's intrinsic value.
- Step 5: Utilize the results for investment strategies or reporting purposes.
Why Opt for Accelink Technologies Co., Ltd. (002281SZ)?
- Time-Saving: Utilize our advanced tools without the hassle of starting from scratch.
- Enhanced Accuracy: Dependable financial insights and calculations minimize valuation errors.
- Completely Customizable: Adjust the model to align with your specific assumptions and forecasts.
- User-Friendly: Intuitive charts and results simplify data interpretation and analysis.
- Recognized by Professionals: Crafted for experts who prioritize accuracy and practicality.
Who Can Benefit from Accelink Technologies Co., Ltd. (002281SZ)?
- Investors: Assess the valuation of Accelink Technologies (002281SZ) when considering stock transactions.
- CFOs and Financial Analysts: Optimize valuation methodologies and evaluate financial forecasts.
- Startup Founders: Gain insights into how established companies like Accelink Technologies (002281SZ) are appraised.
- Consultants: Produce detailed valuation reports for your clients featuring Accelink Technologies (002281SZ).
- Students and Educators: Utilize real market data to practice and impart valuation skills effectively.
Contents of the Template
- Pre-Filled Data: Contains Accelink Technologies' historical financial performance and projections.
- Discounted Cash Flow Model: An editable DCF valuation model with automatic computation features.
- Weighted Average Cost of Capital (WACC): A dedicated worksheet for WACC calculation based on user-defined inputs.
- Key Financial Ratios: Evaluate Accelink's profitability, operational efficiency, and capital structure.
- Customizable Inputs: Easily modify revenue growth rates, profit margins, and tax assumptions.
- User-Friendly Dashboard: Visualizations and tables that consolidate critical valuation findings.
Disclaimer
All information, articles, and product details provided on this website are for general informational and educational purposes only. We do not claim any ownership over, nor do we intend to infringe upon, any trademarks, copyrights, logos, brand names, or other intellectual property mentioned or depicted on this site. Such intellectual property remains the property of its respective owners, and any references here are made solely for identification or informational purposes, without implying any affiliation, endorsement, or partnership.
We make no representations or warranties, express or implied, regarding the accuracy, completeness, or suitability of any content or products presented. Nothing on this website should be construed as legal, tax, investment, financial, medical, or other professional advice. In addition, no part of this site—including articles or product references—constitutes a solicitation, recommendation, endorsement, advertisement, or offer to buy or sell any securities, franchises, or other financial instruments, particularly in jurisdictions where such activity would be unlawful.
All content is of a general nature and may not address the specific circumstances of any individual or entity. It is not a substitute for professional advice or services. Any actions you take based on the information provided here are strictly at your own risk. You accept full responsibility for any decisions or outcomes arising from your use of this website and agree to release us from any liability in connection with your use of, or reliance upon, the content or products found herein.