
|
Focus Technology Co., Ltd. (002315.sz) Avaliação DCF |
Totalmente Editável: Adapte-Se Às Suas Necessidades No Excel Ou Planilhas
Design Profissional: Modelos Confiáveis E Padrão Da Indústria
Pré-Construídos Para Uso Rápido E Eficiente
Compatível com MAC/PC, totalmente desbloqueado
Não É Necessária Experiência; Fácil De Seguir
Focus Technology Co., Ltd. (002315.SZ) Bundle
Atualize sua análise e melhore a precisão com a calculadora DCF (002315SZ)! Utilizando dados reais da Focus Technology Co., Ltd. e permitindo suposições personalizáveis, essa ferramenta o capacita a prever, analisar e valorizar (002315SZ) como um investidor experiente.
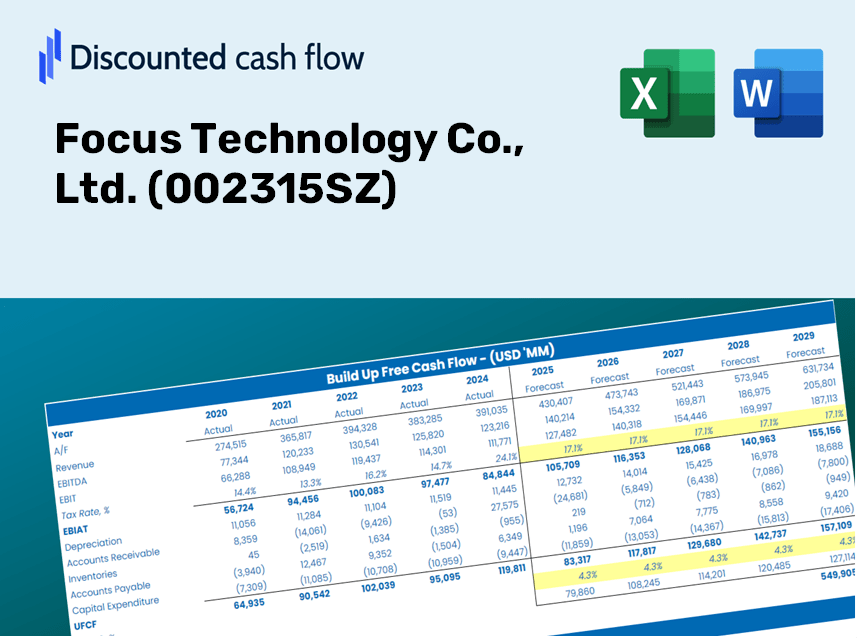
Discounted Cash Flow (DCF) - (USD MM)
| Year | AY1 2020 |
AY2 2021 |
AY3 2022 |
AY4 2023 |
AY5 2024 |
FY1 2025 |
FY2 2026 |
FY3 2027 |
FY4 2028 |
FY5 2029 |
|---|---|---|---|---|---|---|---|---|---|---|
| Revenue | 1,158.6 | 1,474.8 | 1,474.9 | 1,526.6 | 1,668.8 | 1,836.2 | 2,020.4 | 2,223.1 | 2,446.1 | 2,691.5 |
| Revenue Growth, % | 0 | 27.3 | 0.000545005656 | 3.51 | 9.32 | 10.03 | 10.03 | 10.03 | 10.03 | 10.03 |
| EBITDA | 193.6 | 274.7 | 335.7 | 373.8 | 463.2 | 405.2 | 445.9 | 490.6 | 539.8 | 594.0 |
| EBITDA, % | 16.71 | 18.62 | 22.76 | 24.48 | 27.76 | 22.07 | 22.07 | 22.07 | 22.07 | 22.07 |
| Depreciation | 41.7 | 62.7 | 61.7 | 56.7 | 53.2 | 69.5 | 76.5 | 84.2 | 92.6 | 101.9 |
| Depreciation, % | 3.6 | 4.25 | 4.18 | 3.71 | 3.19 | 3.79 | 3.79 | 3.79 | 3.79 | 3.79 |
| EBIT | 152.0 | 212.0 | 274.0 | 317.1 | 410.1 | 335.7 | 369.4 | 406.4 | 447.2 | 492.1 |
| EBIT, % | 13.12 | 14.37 | 18.58 | 20.77 | 24.57 | 18.28 | 18.28 | 18.28 | 18.28 | 18.28 |
| Total Cash | 1,551.8 | 1,850.9 | 2,062.8 | 1,838.0 | 1,659.8 | 1,834.2 | 2,018.2 | 2,220.7 | 2,443.4 | 2,688.6 |
| Total Cash, percent | .0 | .0 | .0 | .0 | .0 | .0 | .0 | .0 | .0 | .0 |
| Account Receivables | 33.1 | 36.1 | 29.9 | 29.8 | 44.7 | 43.9 | 48.3 | 53.2 | 58.5 | 64.4 |
| Account Receivables, % | 2.85 | 2.45 | 2.02 | 1.95 | 2.68 | 2.39 | 2.39 | 2.39 | 2.39 | 2.39 |
| Inventories | 25.6 | 21.9 | 12.7 | 5.7 | 3.8 | 19.0 | 20.9 | 22.9 | 25.3 | 27.8 |
| Inventories, % | 2.21 | 1.49 | 0.85934 | 0.37339 | 0.22908 | 1.03 | 1.03 | 1.03 | 1.03 | 1.03 |
| Accounts Payable | 188.0 | 149.3 | 127.2 | 79.8 | 80.2 | 165.3 | 181.8 | 200.1 | 220.2 | 242.2 |
| Accounts Payable, % | 16.23 | 10.13 | 8.62 | 5.23 | 4.8 | 9 | 9 | 9 | 9 | 9 |
| Capital Expenditure | -121.8 | -85.5 | -45.0 | -71.3 | -20.3 | -92.7 | -102.0 | -112.3 | -123.5 | -135.9 |
| Capital Expenditure, % | -10.51 | -5.8 | -3.05 | -4.67 | -1.22 | -5.05 | -5.05 | -5.05 | -5.05 | -5.05 |
| Tax Rate, % | 9.03 | 9.03 | 9.03 | 9.03 | 9.03 | 9.03 | 9.03 | 9.03 | 9.03 | 9.03 |
| EBITAT | 137.3 | 189.4 | 250.0 | 304.0 | 373.0 | 307.4 | 338.2 | 372.1 | 409.5 | 450.5 |
| Depreciation | ||||||||||
| Changes in Account Receivables | ||||||||||
| Changes in Inventories | ||||||||||
| Changes in Accounts Payable | ||||||||||
| Capital Expenditure | ||||||||||
| UFCF | 186.5 | 128.6 | 260.0 | 249.1 | 393.2 | 354.9 | 322.9 | 355.3 | 391.0 | 430.2 |
| WACC, % | 5.66 | 5.66 | 5.66 | 5.66 | 5.66 | 5.66 | 5.66 | 5.66 | 5.66 | 5.66 |
| PV UFCF | ||||||||||
| SUM PV UFCF | 1,566.9 | |||||||||
| Long Term Growth Rate, % | 3.50 | |||||||||
| Free cash flow (T + 1) | 445 | |||||||||
| Terminal Value | 20,651 | |||||||||
| Present Terminal Value | 15,685 | |||||||||
| Enterprise Value | 17,252 | |||||||||
| Net Debt | -1,549 | |||||||||
| Equity Value | 18,801 | |||||||||
| Diluted Shares Outstanding, MM | 317 | |||||||||
| Equity Value Per Share | 59.31 |
What You Will Receive
- Comprehensive Financial Model: Leverage Focus Technology Co., Ltd.'s actual performance data for accurate DCF valuation.
- Complete Forecast Flexibility: Modify revenue growth, profit margins, WACC, and other critical parameters.
- Real-Time Calculations: Automatic adjustments provide immediate visibility of results as you make edits.
- Professional-Grade Template: An expertly crafted Excel file tailored for high-quality valuation purposes.
- Customizable and Reusable: Designed for adaptability, allowing you to conduct detailed forecasts repeatedly.
Key Features
- Pre-Loaded Data: Focus Technology Co., Ltd.'s historical financial statements and pre-filled forecasts.
- Fully Adjustable Inputs: Modify WACC, tax rates, revenue growth, and EBITDA margins as needed.
- Instant Results: Watch the intrinsic value of Focus Technology Co., Ltd. (002315SZ) recalculate in real time.
- Clear Visual Outputs: Dashboard charts showcase valuation results and essential metrics.
- Built for Accuracy: A professional-grade tool designed for analysts, investors, and finance professionals.
How It Functions
- Step 1: Download the Excel spreadsheet.
- Step 2: Examine Focus Technology Co., Ltd.'s pre-filled financial data and projections.
- Step 3: Adjust key inputs such as revenue growth, WACC, and tax rates (highlighted cells).
- Step 4: Observe the DCF model refresh in real-time as you modify your assumptions.
- Step 5: Evaluate the results and leverage the findings for your investment strategies.
Why Opt for This Calculator?
- All-in-One Solution: Features DCF, WACC, and financial ratio analyses seamlessly integrated.
- Flexible Inputs: Modify the yellow-highlighted cells to explore different scenarios.
- In-Depth Analysis: Automatically computes the intrinsic value and Net Present Value for Focus Technology Co., Ltd. (002315SZ).
- Ready-to-Use Data: Comes with historical and projected data for reliable initial calculations.
- Expert-Level Precision: Perfect for financial analysts, investors, and business consultants alike.
Who Can Benefit from Focus Technology Co., Ltd. (002315SZ)?
- Investors: Make informed choices with a high-quality valuation tool designed for privacy technology insights.
- Financial Analysts: Streamline your work using a customizable DCF model specifically for tech evaluations.
- Consultants: Easily modify the template for client presentations or analytical reports in the technology sector.
- Tech Enthusiasts: Enhance your grasp of valuation methods through practical examples from the tech industry.
- Educators and Students: Leverage this resource as an effective educational tool in technology finance courses.
Contents of the Template
- Historical Data: Comprises Focus Technology's past financial performance and baseline forecasts.
- DCF and Levered DCF Models: Comprehensive templates for assessing the intrinsic value of Focus Technology (002315SZ).
- WACC Sheet: Pre-calculated metrics for the Weighted Average Cost of Capital.
- Editable Inputs: Adjust essential parameters such as growth rates, EBITDA percentages, and CAPEX estimates.
- Quarterly and Annual Statements: An extensive analysis of Focus Technology's financial statements.
- Interactive Dashboard: Dynamically visualize valuation outcomes and future projections.
Disclaimer
All information, articles, and product details provided on this website are for general informational and educational purposes only. We do not claim any ownership over, nor do we intend to infringe upon, any trademarks, copyrights, logos, brand names, or other intellectual property mentioned or depicted on this site. Such intellectual property remains the property of its respective owners, and any references here are made solely for identification or informational purposes, without implying any affiliation, endorsement, or partnership.
We make no representations or warranties, express or implied, regarding the accuracy, completeness, or suitability of any content or products presented. Nothing on this website should be construed as legal, tax, investment, financial, medical, or other professional advice. In addition, no part of this site—including articles or product references—constitutes a solicitation, recommendation, endorsement, advertisement, or offer to buy or sell any securities, franchises, or other financial instruments, particularly in jurisdictions where such activity would be unlawful.
All content is of a general nature and may not address the specific circumstances of any individual or entity. It is not a substitute for professional advice or services. Any actions you take based on the information provided here are strictly at your own risk. You accept full responsibility for any decisions or outcomes arising from your use of this website and agree to release us from any liability in connection with your use of, or reliance upon, the content or products found herein.