
|
Zhejiang Jiuli Hi-Tech Metals Co., Ltd. (002318.sz) Avaliação DCF |
Totalmente Editável: Adapte-Se Às Suas Necessidades No Excel Ou Planilhas
Design Profissional: Modelos Confiáveis E Padrão Da Indústria
Pré-Construídos Para Uso Rápido E Eficiente
Compatível com MAC/PC, totalmente desbloqueado
Não É Necessária Experiência; Fácil De Seguir
Zhejiang Jiuli Hi-Tech Metals Co., Ltd. (002318.SZ) Bundle
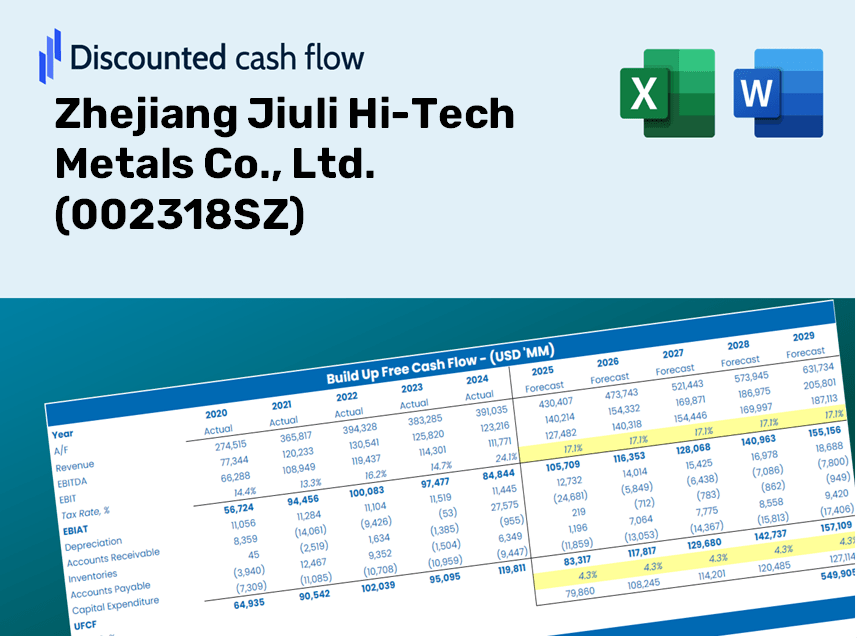
Obtenha informações sobre a análise de avaliação Zhejiang Jiuli Hi-Tech Metals Co., Ltd. (002318SZ) com nossa sofisticada calculadora DCF! Pré-carregado com dados reais (002318SZ), este modelo do Excel permite ajustar as previsões e suposições para determinar o valor intrínseco de Zhejiang Jiuli Hi-Tech Metals Co., Ltd. com precisão.
Discounted Cash Flow (DCF) - (USD MM)
| Year | AY1 2020 |
AY2 2021 |
AY3 2022 |
AY4 2023 |
AY5 2024 |
FY1 2025 |
FY2 2026 |
FY3 2027 |
FY4 2028 |
FY5 2029 |
|---|---|---|---|---|---|---|---|---|---|---|
| Revenue | 4,955.2 | 5,973.8 | 6,537.3 | 8,568.4 | 10,918.3 | 13,333.5 | 16,282.9 | 19,884.8 | 24,283.4 | 29,655.1 |
| Revenue Growth, % | 0 | 20.56 | 9.43 | 31.07 | 27.42 | 22.12 | 22.12 | 22.12 | 22.12 | 22.12 |
| EBITDA | 1,023.5 | 1,000.0 | 1,086.4 | 1,477.3 | 2,048.3 | 2,400.4 | 2,931.4 | 3,579.9 | 4,371.8 | 5,338.8 |
| EBITDA, % | 20.65 | 16.74 | 16.62 | 17.24 | 18.76 | 18 | 18 | 18 | 18 | 18 |
| Depreciation | 215.8 | 239.7 | 279.9 | 335.8 | 353.9 | 528.3 | 645.1 | 787.8 | 962.1 | 1,174.9 |
| Depreciation, % | 4.35 | 4.01 | 4.28 | 3.92 | 3.24 | 3.96 | 3.96 | 3.96 | 3.96 | 3.96 |
| EBIT | 807.7 | 760.3 | 806.5 | 1,141.5 | 1,694.4 | 1,872.2 | 2,286.3 | 2,792.0 | 3,409.7 | 4,163.9 |
| EBIT, % | 16.3 | 12.73 | 12.34 | 13.32 | 15.52 | 14.04 | 14.04 | 14.04 | 14.04 | 14.04 |
| Total Cash | 1,278.7 | 1,326.8 | 1,982.3 | 4,319.5 | 2,821.8 | 4,122.6 | 5,034.5 | 6,148.2 | 7,508.2 | 9,169.0 |
| Total Cash, percent | .0 | .0 | .0 | .0 | .0 | .0 | .0 | .0 | .0 | .0 |
| Account Receivables | 735.0 | 1,207.0 | 1,297.5 | 1,654.5 | 1,758.5 | 2,408.0 | 2,940.7 | 3,591.2 | 4,385.6 | 5,355.7 |
| Account Receivables, % | 14.83 | 20.21 | 19.85 | 19.31 | 16.11 | 18.06 | 18.06 | 18.06 | 18.06 | 18.06 |
| Inventories | 1,385.5 | 1,490.2 | 1,999.2 | 2,441.9 | 3,413.2 | 3,820.0 | 4,665.0 | 5,696.9 | 6,957.1 | 8,496.1 |
| Inventories, % | 27.96 | 24.94 | 30.58 | 28.5 | 31.26 | 28.65 | 28.65 | 28.65 | 28.65 | 28.65 |
| Accounts Payable | 151.8 | 1,144.9 | 1,280.5 | 650.5 | 745.4 | 1,499.6 | 1,831.3 | 2,236.4 | 2,731.2 | 3,335.3 |
| Accounts Payable, % | 3.06 | 19.17 | 19.59 | 7.59 | 6.83 | 11.25 | 11.25 | 11.25 | 11.25 | 11.25 |
| Capital Expenditure | -432.6 | -738.2 | -416.7 | -447.6 | -593.4 | -1,016.5 | -1,241.4 | -1,516.0 | -1,851.3 | -2,260.9 |
| Capital Expenditure, % | -8.73 | -12.36 | -6.37 | -5.22 | -5.44 | -7.62 | -7.62 | -7.62 | -7.62 | -7.62 |
| Tax Rate, % | 17.71 | 17.71 | 17.71 | 17.71 | 17.71 | 17.71 | 17.71 | 17.71 | 17.71 | 17.71 |
| EBITAT | 690.0 | 667.0 | 750.1 | 974.8 | 1,394.3 | 1,624.4 | 1,983.8 | 2,422.6 | 2,958.5 | 3,612.9 |
| Depreciation | ||||||||||
| Changes in Account Receivables | ||||||||||
| Changes in Inventories | ||||||||||
| Changes in Accounts Payable | ||||||||||
| Capital Expenditure | ||||||||||
| UFCF | -1,495.5 | 585.0 | 149.3 | -566.7 | 174.5 | 834.1 | 341.6 | 417.1 | 509.4 | 622.1 |
| WACC, % | 5.31 | 5.31 | 5.32 | 5.31 | 5.3 | 5.31 | 5.31 | 5.31 | 5.31 | 5.31 |
| PV UFCF | ||||||||||
| SUM PV UFCF | 2,351.6 | |||||||||
| Long Term Growth Rate, % | 3.00 | |||||||||
| Free cash flow (T + 1) | 641 | |||||||||
| Terminal Value | 27,742 | |||||||||
| Present Terminal Value | 21,419 | |||||||||
| Enterprise Value | 23,771 | |||||||||
| Net Debt | -1,976 | |||||||||
| Equity Value | 25,747 | |||||||||
| Diluted Shares Outstanding, MM | 962 | |||||||||
| Equity Value Per Share | 26.78 |
Benefits of Our Offering
- Comprehensive ZJHT Financial Data: Pre-loaded with historical and projected figures for Zhejiang Jiuli Hi-Tech Metals Co., Ltd. for in-depth analysis.
- Customizable Template: Easily adjust essential inputs such as revenue growth, WACC, and EBITDA percentage.
- Instant Calculations: Observe real-time updates of ZJHT's intrinsic value as you make adjustments.
- Expert Valuation Tool: Tailored for investors, analysts, and consultants aiming for precise DCF evaluations.
- Intuitive Interface: A straightforward layout and clear guidance suitable for users of all experience levels.
Key Features
- Comprehensive Zhejiang Jiuli Data: Pre-populated with historical financial figures and future projections for Zhejiang Jiuli Hi-Tech Metals Co., Ltd. (002318SZ).
- Customizable Assumptions: Modify inputs such as revenue growth rates, profit margins, discount rates, tax considerations, and capital investment.
- Interactive Valuation Framework: Automatically recalculates Net Present Value (NPV) and intrinsic value in response to your adjustments.
- Scenario Analysis: Generate various forecasting scenarios to evaluate different potential valuation outcomes.
- Intuitive Interface: Designed for ease of use, catering to both experienced professionals and newcomers.
How It Functions
- Download the Template: Gain immediate access to the Excel-based DCF Calculator for Zhejiang Jiuli Hi-Tech Metals Co., Ltd. (002318SZ).
- Input Your Assumptions: Modify the yellow-highlighted cells for growth rates, WACC, margins, and other variables.
- Instant Calculations: The model automatically recalculates the intrinsic value of Zhejiang Jiuli Hi-Tech Metals Co., Ltd. (002318SZ).
- Test Scenarios: Experiment with various assumptions to assess potential changes in valuation.
- Analyze and Decide: Utilize the outcomes to inform your investment strategies or financial assessments.
Why Choose This Calculator for Zhejiang Jiuli Hi-Tech Metals Co., Ltd. (002318SZ)?
- All-in-One Solution: Combines DCF, WACC, and financial ratio analyses for a comprehensive assessment.
- Flexible Inputs: Modify the highlighted cells to explore different financial scenarios.
- In-Depth Analysis: Automatically computes the intrinsic value and Net Present Value for Zhejiang Jiuli Hi-Tech Metals Co., Ltd.
- Preloaded Information: Access historical and projected data for reliable calculations.
- Designed for Professionals: Perfect for financial analysts, investors, and business consultants focused on Zhejiang Jiuli Hi-Tech Metals Co., Ltd.
Who Should Utilize This Product?
- Investors: Assess Zhejiang Jiuli Hi-Tech Metals Co., Ltd. (002318SZ) valuation before making stock trades.
- CFOs and Financial Analysts: Enhance valuation workflows and evaluate financial forecasts.
- Startup Founders: Discover the valuation methods used by established companies like Zhejiang Jiuli Hi-Tech Metals Co., Ltd. (002318SZ).
- Consultants: Create comprehensive valuation reports for your clients.
- Students and Educators: Utilize actual data to practice and instruct on valuation strategies.
Contents of the Template
- Pre-Filled DCF Model: Zhejiang Jiuli Hi-Tech Metals Co., Ltd.'s financial data pre-loaded for immediate application.
- WACC Calculator: Comprehensive calculations for the Weighted Average Cost of Capital.
- Financial Ratios: Analyze Zhejiang Jiuli's profitability, leverage, and operational efficiency.
- Editable Inputs: Adjust assumptions like growth rates, margins, and CAPEX to suit your specific scenarios.
- Financial Statements: Access annual and quarterly reports for in-depth analysis.
- Interactive Dashboard: Effortlessly visualize essential valuation metrics and outcomes.
Disclaimer
All information, articles, and product details provided on this website are for general informational and educational purposes only. We do not claim any ownership over, nor do we intend to infringe upon, any trademarks, copyrights, logos, brand names, or other intellectual property mentioned or depicted on this site. Such intellectual property remains the property of its respective owners, and any references here are made solely for identification or informational purposes, without implying any affiliation, endorsement, or partnership.
We make no representations or warranties, express or implied, regarding the accuracy, completeness, or suitability of any content or products presented. Nothing on this website should be construed as legal, tax, investment, financial, medical, or other professional advice. In addition, no part of this site—including articles or product references—constitutes a solicitation, recommendation, endorsement, advertisement, or offer to buy or sell any securities, franchises, or other financial instruments, particularly in jurisdictions where such activity would be unlawful.
All content is of a general nature and may not address the specific circumstances of any individual or entity. It is not a substitute for professional advice or services. Any actions you take based on the information provided here are strictly at your own risk. You accept full responsibility for any decisions or outcomes arising from your use of this website and agree to release us from any liability in connection with your use of, or reliance upon, the content or products found herein.