
|
Shanghai Pret Composites Co., Ltd. (002324.sz) Avaliação DCF |
Totalmente Editável: Adapte-Se Às Suas Necessidades No Excel Ou Planilhas
Design Profissional: Modelos Confiáveis E Padrão Da Indústria
Pré-Construídos Para Uso Rápido E Eficiente
Compatível com MAC/PC, totalmente desbloqueado
Não É Necessária Experiência; Fácil De Seguir
Shanghai Pret Composites Co., Ltd. (002324.SZ) Bundle
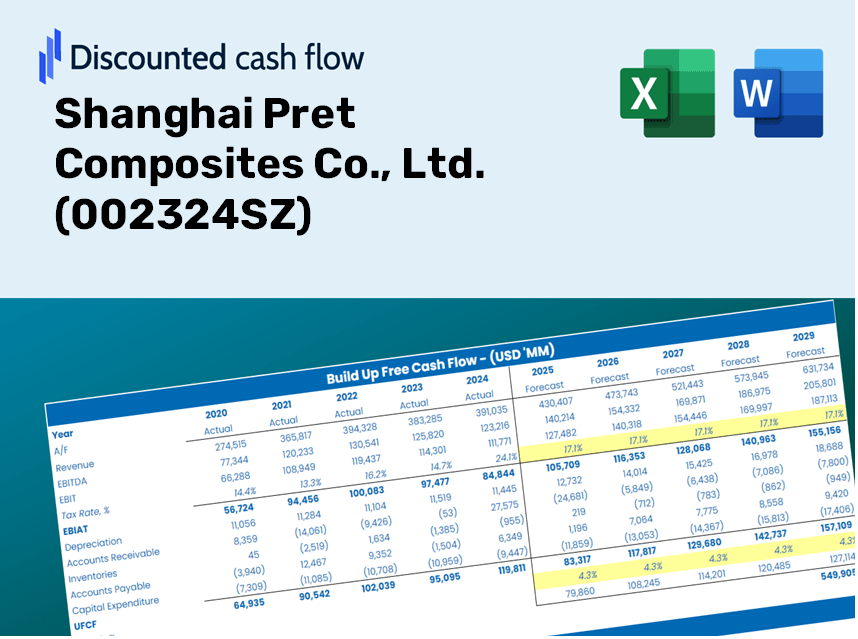
Projetado para precisão, nossa calculadora DCF (002324SZ) permite avaliar a avaliação da Shanghai Pret Composites Co., Ltd. usando dados financeiros do mundo real e fornece flexibilidade completa para modificar todos os parâmetros essenciais para projeções aprimoradas.
Discounted Cash Flow (DCF) - (USD MM)
| Year | AY1 2020 |
AY2 2021 |
AY3 2022 |
AY4 2023 |
AY5 2024 |
FY1 2025 |
FY2 2026 |
FY3 2027 |
FY4 2028 |
FY5 2029 |
|---|---|---|---|---|---|---|---|---|---|---|
| Revenue | 4,447.5 | 4,870.8 | 6,758.5 | 8,709.4 | 8,313.5 | 9,822.3 | 11,604.9 | 13,710.9 | 16,199.2 | 19,139.1 |
| Revenue Growth, % | 0 | 9.52 | 38.76 | 28.87 | -4.54 | 18.15 | 18.15 | 18.15 | 18.15 | 18.15 |
| EBITDA | 581.8 | 164.5 | 394.9 | 783.3 | 506.5 | 734.5 | 867.7 | 1,025.2 | 1,211.3 | 1,431.1 |
| EBITDA, % | 13.08 | 3.38 | 5.84 | 8.99 | 6.09 | 7.48 | 7.48 | 7.48 | 7.48 | 7.48 |
| Depreciation | 96.2 | 98.4 | 131.3 | 210.8 | 258.3 | 228.9 | 270.5 | 319.5 | 377.5 | 446.0 |
| Depreciation, % | 2.16 | 2.02 | 1.94 | 2.42 | 3.11 | 2.33 | 2.33 | 2.33 | 2.33 | 2.33 |
| EBIT | 485.5 | 66.1 | 263.6 | 572.5 | 248.2 | 505.5 | 597.3 | 705.7 | 833.8 | 985.1 |
| EBIT, % | 10.92 | 1.36 | 3.9 | 6.57 | 2.99 | 5.15 | 5.15 | 5.15 | 5.15 | 5.15 |
| Total Cash | 317.1 | 488.3 | 410.5 | 1,468.4 | 953.5 | 1,012.8 | 1,196.6 | 1,413.8 | 1,670.4 | 1,973.5 |
| Total Cash, percent | .0 | .0 | .0 | .0 | .0 | .0 | .0 | .0 | .0 | .0 |
| Account Receivables | 1,881.1 | 1,940.3 | 3,152.4 | 4,231.7 | 3,902.1 | 4,406.3 | 5,205.9 | 6,150.7 | 7,267.0 | 8,585.8 |
| Account Receivables, % | 42.3 | 39.84 | 46.64 | 48.59 | 46.94 | 44.86 | 44.86 | 44.86 | 44.86 | 44.86 |
| Inventories | 678.2 | 839.9 | 1,766.8 | 1,823.8 | 1,751.4 | 1,977.1 | 2,335.9 | 2,759.8 | 3,260.6 | 3,852.4 |
| Inventories, % | 15.25 | 17.24 | 26.14 | 20.94 | 21.07 | 20.13 | 20.13 | 20.13 | 20.13 | 20.13 |
| Accounts Payable | 422.2 | 503.8 | 1,418.7 | 2,556.1 | 1,528.1 | 1,739.7 | 2,055.4 | 2,428.4 | 2,869.1 | 3,389.8 |
| Accounts Payable, % | 9.49 | 10.34 | 20.99 | 29.35 | 18.38 | 17.71 | 17.71 | 17.71 | 17.71 | 17.71 |
| Capital Expenditure | -112.1 | -77.4 | -131.6 | -969.3 | -726.7 | -509.3 | -601.8 | -711.0 | -840.0 | -992.4 |
| Capital Expenditure, % | -2.52 | -1.59 | -1.95 | -11.13 | -8.74 | -5.19 | -5.19 | -5.19 | -5.19 | -5.19 |
| Tax Rate, % | -4.18 | -4.18 | -4.18 | -4.18 | -4.18 | -4.18 | -4.18 | -4.18 | -4.18 | -4.18 |
| EBITAT | 413.4 | 44.9 | 254.7 | 540.4 | 258.6 | 449.0 | 530.5 | 626.8 | 740.5 | 874.9 |
| Depreciation | ||||||||||
| Changes in Account Receivables | ||||||||||
| Changes in Inventories | ||||||||||
| Changes in Accounts Payable | ||||||||||
| Capital Expenditure | ||||||||||
| UFCF | -1,739.6 | -73.5 | -969.6 | -217.0 | -835.8 | -349.7 | -643.5 | -760.3 | -898.3 | -1,061.3 |
| WACC, % | 4.54 | 4.4 | 4.63 | 4.61 | 4.66 | 4.57 | 4.57 | 4.57 | 4.57 | 4.57 |
| PV UFCF | ||||||||||
| SUM PV UFCF | -3,188.3 | |||||||||
| Long Term Growth Rate, % | 3.50 | |||||||||
| Free cash flow (T + 1) | -1,098 | |||||||||
| Terminal Value | -103,076 | |||||||||
| Present Terminal Value | -82,454 | |||||||||
| Enterprise Value | -85,643 | |||||||||
| Net Debt | 3,157 | |||||||||
| Equity Value | -88,799 | |||||||||
| Diluted Shares Outstanding, MM | 1,099 | |||||||||
| Equity Value Per Share | -80.78 |
Benefits You Will Receive
- Authentic 002324SZ Financials: Access to historical and projected data for precise valuation.
- Customizable Parameters: Adjust WACC, tax rates, revenue growth, and capital investments as needed.
- Real-Time Calculations: Intrinsic value and NPV are computed automatically.
- Scenario Analysis: Explore various scenarios to assess the future outlook of Shanghai Pret Composites.
- User-Friendly Interface: Designed for industry professionals while remaining user-friendly for newcomers.
Key Features
- 🔍 Real-Life Shanghai Pret Composites Financials: Pre-filled historical and projected data for Shanghai Pret Composites Co., Ltd. (002324SZ).
- ✏️ Fully Customizable Inputs: Adjust all key parameters (yellow cells) such as WACC, growth %, and tax rates.
- 📊 Professional DCF Valuation: Integrated formulas calculate the intrinsic value of Shanghai Pret Composites using the Discounted Cash Flow method.
- ⚡ Instant Results: Visualize the valuation of Shanghai Pret Composites immediately after making adjustments.
- Scenario Analysis: Evaluate and compare outcomes based on various financial assumptions side-by-side.
How It Works
- Step 1: Download the Excel file for Shanghai Pret Composites Co., Ltd. (002324SZ).
- Step 2: Examine the pre-filled financial data and projections for Shanghai Pret Composites.
- Step 3: Adjust key variables such as revenue growth, WACC, and tax rates (highlighted cells).
- Step 4: Observe the DCF model refresh in real-time as you change your assumptions.
- Step 5: Evaluate the outputs and leverage the results for your investment strategies.
Why Opt for This Tool?
- Designed for Experts: A sophisticated instrument tailored for analysts, CFOs, and consultants.
- Accurate Data: Shanghai Pret Composites Co., Ltd.'s historical and projected financials preloaded for reliability.
- Flexible Scenario Analysis: Effortlessly simulate various forecasts and assumptions.
- Comprehensive Outputs: Automatically computes intrinsic value, NPV, and essential metrics.
- User-Friendly: Step-by-step guidance ensures an intuitive experience.
Who Can Benefit from This Product?
- Individual Investors: Gain insights for informed decision-making regarding Shanghai Pret Composites Co., Ltd. (002324SZ) stock transactions.
- Financial Analysts: Enhance the valuation process with accessible financial models tailored for Shanghai Pret Composites Co., Ltd. (002324SZ).
- Consultants: Provide clients with accurate and timely valuation analyses for Shanghai Pret Composites Co., Ltd. (002324SZ).
- Business Owners: Learn how large firms like Shanghai Pret Composites Co., Ltd. (002324SZ) are valued to inform your strategic decisions.
- Finance Students: Acquire practical knowledge of valuation methods by leveraging real-world data related to Shanghai Pret Composites Co., Ltd. (002324SZ).
Contents of the Template
- Pre-Filled Data: Contains historical financials and forecasts for Shanghai Pret Composites Co., Ltd. (002324SZ).
- Discounted Cash Flow Model: Fully editable DCF valuation model with automatic calculations.
- Weighted Average Cost of Capital (WACC): A separate sheet for computing WACC using customized inputs.
- Key Financial Ratios: Evaluate Shanghai Pret Composites' profitability, efficiency, and leverage metrics.
- Customizable Inputs: Easily modify assumptions for revenue growth, profit margins, and tax rates.
- Clear Dashboard: Visual representations and tables summarizing essential valuation outcomes.
Disclaimer
All information, articles, and product details provided on this website are for general informational and educational purposes only. We do not claim any ownership over, nor do we intend to infringe upon, any trademarks, copyrights, logos, brand names, or other intellectual property mentioned or depicted on this site. Such intellectual property remains the property of its respective owners, and any references here are made solely for identification or informational purposes, without implying any affiliation, endorsement, or partnership.
We make no representations or warranties, express or implied, regarding the accuracy, completeness, or suitability of any content or products presented. Nothing on this website should be construed as legal, tax, investment, financial, medical, or other professional advice. In addition, no part of this site—including articles or product references—constitutes a solicitation, recommendation, endorsement, advertisement, or offer to buy or sell any securities, franchises, or other financial instruments, particularly in jurisdictions where such activity would be unlawful.
All content is of a general nature and may not address the specific circumstances of any individual or entity. It is not a substitute for professional advice or services. Any actions you take based on the information provided here are strictly at your own risk. You accept full responsibility for any decisions or outcomes arising from your use of this website and agree to release us from any liability in connection with your use of, or reliance upon, the content or products found herein.