
|
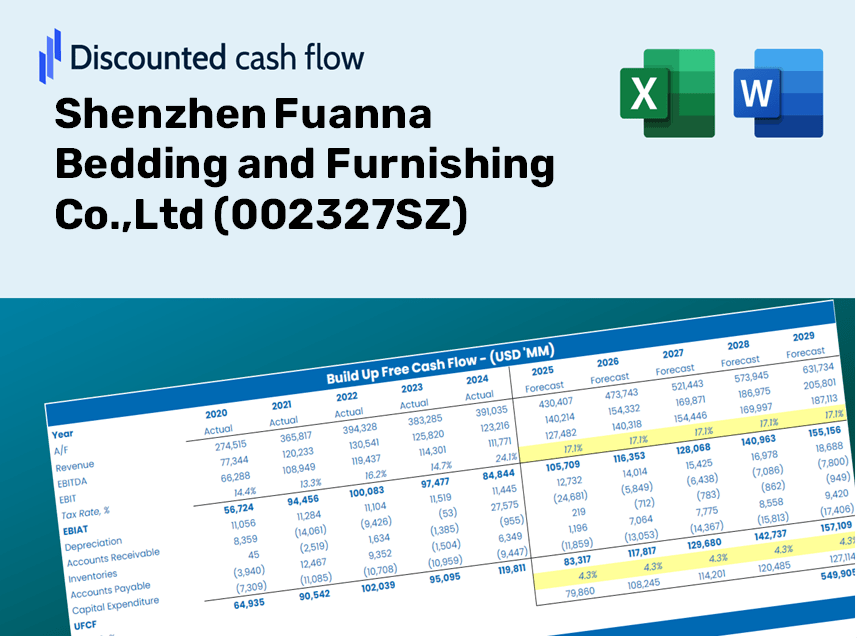
SHENZHEN FUANNS Bedding and Furnishing Co., Ltd (002327.sz) Avaliação DCF |
Totalmente Editável: Adapte-Se Às Suas Necessidades No Excel Ou Planilhas
Design Profissional: Modelos Confiáveis E Padrão Da Indústria
Pré-Construídos Para Uso Rápido E Eficiente
Compatível com MAC/PC, totalmente desbloqueado
Não É Necessária Experiência; Fácil De Seguir
Shenzhen Fuanna Bedding and Furnishing Co.,Ltd (002327.SZ) Bundle
Seja você um investidor ou analista, esta calculadora DCF (002327SZ) é o seu recurso preferido para uma avaliação precisa. Pré -carregado com dados reais da Shenzhen Fuanna Bedding and Furnishing Co., LTD, você pode ajustar facilmente as previsões e observar os efeitos em tempo real.
Discounted Cash Flow (DCF) - (USD MM)
| Year | AY1 2020 |
AY2 2021 |
AY3 2022 |
AY4 2023 |
AY5 2024 |
FY1 2025 |
FY2 2026 |
FY3 2027 |
FY4 2028 |
FY5 2029 |
|---|---|---|---|---|---|---|---|---|---|---|
| Revenue | 2,874.0 | 3,179.3 | 3,079.6 | 3,029.6 | 3,011.3 | 3,050.8 | 3,090.9 | 3,131.5 | 3,172.7 | 3,214.4 |
| Revenue Growth, % | 0 | 10.62 | -3.14 | -1.62 | -0.60457 | 1.31 | 1.31 | 1.31 | 1.31 | 1.31 |
| EBITDA | 682.3 | 898.4 | 828.5 | 915.2 | 847.9 | 837.6 | 848.6 | 859.7 | 871.0 | 882.5 |
| EBITDA, % | 23.74 | 28.26 | 26.9 | 30.21 | 28.16 | 27.45 | 27.45 | 27.45 | 27.45 | 27.45 |
| Depreciation | 105.5 | 207.9 | 214.6 | 212.2 | 182.7 | 184.6 | 187.0 | 189.5 | 191.9 | 194.5 |
| Depreciation, % | 3.67 | 6.54 | 6.97 | 7 | 6.07 | 6.05 | 6.05 | 6.05 | 6.05 | 6.05 |
| EBIT | 576.8 | 690.5 | 613.8 | 703.0 | 665.2 | 653.0 | 661.6 | 670.3 | 679.1 | 688.0 |
| EBIT, % | 20.07 | 21.72 | 19.93 | 23.21 | 22.09 | 21.4 | 21.4 | 21.4 | 21.4 | 21.4 |
| Total Cash | 1,414.4 | 1,285.8 | 1,505.4 | 1,305.4 | 1,118.6 | 1,334.9 | 1,352.4 | 1,370.2 | 1,388.2 | 1,406.5 |
| Total Cash, percent | .0 | .0 | .0 | .0 | .0 | .0 | .0 | .0 | .0 | .0 |
| Account Receivables | 265.2 | 231.7 | 256.2 | 435.5 | 600.2 | 360.9 | 365.6 | 370.4 | 375.3 | 380.2 |
| Account Receivables, % | 9.23 | 7.29 | 8.32 | 14.38 | 19.93 | 11.83 | 11.83 | 11.83 | 11.83 | 11.83 |
| Inventories | 757.0 | 812.2 | 759.7 | 701.2 | 763.4 | 763.0 | 773.1 | 783.2 | 793.5 | 803.9 |
| Inventories, % | 26.34 | 25.55 | 24.67 | 23.15 | 25.35 | 25.01 | 25.01 | 25.01 | 25.01 | 25.01 |
| Accounts Payable | 420.0 | 408.9 | 236.5 | 393.4 | 324.8 | 359.5 | 364.3 | 369.0 | 373.9 | 378.8 |
| Accounts Payable, % | 14.61 | 12.86 | 7.68 | 12.99 | 10.78 | 11.78 | 11.78 | 11.78 | 11.78 | 11.78 |
| Capital Expenditure | -145.4 | -79.2 | -40.5 | -79.8 | -69.0 | -84.2 | -85.3 | -86.4 | -87.5 | -88.7 |
| Capital Expenditure, % | -5.06 | -2.49 | -1.32 | -2.64 | -2.29 | -2.76 | -2.76 | -2.76 | -2.76 | -2.76 |
| Tax Rate, % | 17.26 | 17.26 | 17.26 | 17.26 | 17.26 | 17.26 | 17.26 | 17.26 | 17.26 | 17.26 |
| EBITAT | 485.4 | 555.8 | 508.4 | 580.1 | 550.4 | 539.0 | 546.1 | 553.3 | 560.5 | 567.9 |
| Depreciation | ||||||||||
| Changes in Account Receivables | ||||||||||
| Changes in Inventories | ||||||||||
| Changes in Accounts Payable | ||||||||||
| Capital Expenditure | ||||||||||
| UFCF | -156.8 | 651.7 | 538.1 | 748.6 | 368.6 | 913.9 | 637.8 | 646.2 | 654.6 | 663.2 |
| WACC, % | 4.68 | 4.67 | 4.68 | 4.67 | 4.68 | 4.67 | 4.67 | 4.67 | 4.67 | 4.67 |
| PV UFCF | ||||||||||
| SUM PV UFCF | 3,091.6 | |||||||||
| Long Term Growth Rate, % | 2.00 | |||||||||
| Free cash flow (T + 1) | 677 | |||||||||
| Terminal Value | 25,293 | |||||||||
| Present Terminal Value | 20,127 | |||||||||
| Enterprise Value | 23,219 | |||||||||
| Net Debt | -252 | |||||||||
| Equity Value | 23,471 | |||||||||
| Diluted Shares Outstanding, MM | 847 | |||||||||
| Equity Value Per Share | 27.70 |
What You Will Receive
- Comprehensive 002327SZ Financial Data: Pre-loaded with Shenzhen Fuanna's historical and forecasted figures for accurate analysis.
- Customizable Template: Easily adjust key metrics such as revenue growth, WACC, and EBITDA percentages.
- Real-Time Calculations: Watch the intrinsic value of Shenzhen Fuanna update immediately as you make changes.
- Expert Valuation Tool: Tailored for investors, analysts, and consultants who require precise DCF outcomes.
- Intuitive Interface: Clear layout and straightforward instructions suitable for users of all skill levels.
Key Features
- Comprehensive DCF Calculator: Offers detailed unlevered and levered DCF valuation models tailored for Shenzhen Fuanna Bedding and Furnishing Co., Ltd (002327SZ).
- WACC Calculator: Features a customizable Weighted Average Cost of Capital sheet suitable for [Symbol].
- Editable Forecast Assumptions: Adjust growth rates, capital expenditures, and discount rates to fit your analysis needs.
- Integrated Financial Ratios: Evaluate profitability, leverage, and efficiency ratios specifically for Shenzhen Fuanna Bedding and Furnishing Co., Ltd (002327SZ).
- Interactive Dashboard and Charts: Present visual summaries of key valuation metrics to facilitate insightful analysis.
How It Functions
- Step 1: Download the Excel spreadsheet.
- Step 2: Examine Fuanna's pre-filled financial information and future projections.
- Step 3: Adjust key parameters such as revenue growth, WACC, and tax rates (highlighted cells).
- Step 4: Observe the DCF model refresh in real-time as you modify assumptions.
- Step 5: Evaluate the results and leverage them for your investment choices.
Why Opt for This Calculator?
- Reliable Data: Accurate financial information from Shenzhen Fuanna Bedding and Furnishing Co., Ltd guarantees trustworthy valuation results.
- Customizable Options: Modify essential variables such as growth rates, WACC, and tax rates to align with your projections.
- Efficient: Pre-configured calculations save you time and effort by eliminating the need to build from the ground up.
- Professional Quality: Crafted for investors, analysts, and consultants alike.
- Easy to Use: User-friendly design and straightforward instructions make it accessible for everyone.
Who Can Benefit from Our Products?
- Investors: Make informed decisions with our premium quality bedding solutions.
- Interior Designers: Enhance your projects with our customizable and stylish bedding options.
- Retailers: Expand your inventory with our diverse range of bedding products tailored for various markets.
- Homeowners: Elevate your living space with our luxurious and comfortable bedding collections.
- Students of Design: Utilize our products as a case study for trends in bedding and furnishing design.
Contents of the Template
- Comprehensive DCF Model: Editable template featuring extensive valuation calculations.
- Real-World Data: Preloaded historical and projected financials for Shenzhen Fuanna Bedding and Furnishing Co., Ltd (002327SZ) for thorough analysis.
- Customizable Parameters: Modify WACC, growth rates, and tax assumptions to explore various scenarios.
- Financial Statements: Complete annual and quarterly breakdowns for enhanced insights.
- Key Ratios: Integrated analysis for profitability, efficiency, and leverage metrics.
- Dashboard with Visual Outputs: Graphs and tables providing clear, actionable insights.
Disclaimer
All information, articles, and product details provided on this website are for general informational and educational purposes only. We do not claim any ownership over, nor do we intend to infringe upon, any trademarks, copyrights, logos, brand names, or other intellectual property mentioned or depicted on this site. Such intellectual property remains the property of its respective owners, and any references here are made solely for identification or informational purposes, without implying any affiliation, endorsement, or partnership.
We make no representations or warranties, express or implied, regarding the accuracy, completeness, or suitability of any content or products presented. Nothing on this website should be construed as legal, tax, investment, financial, medical, or other professional advice. In addition, no part of this site—including articles or product references—constitutes a solicitation, recommendation, endorsement, advertisement, or offer to buy or sell any securities, franchises, or other financial instruments, particularly in jurisdictions where such activity would be unlawful.
All content is of a general nature and may not address the specific circumstances of any individual or entity. It is not a substitute for professional advice or services. Any actions you take based on the information provided here are strictly at your own risk. You accept full responsibility for any decisions or outcomes arising from your use of this website and agree to release us from any liability in connection with your use of, or reliance upon, the content or products found herein.