
|
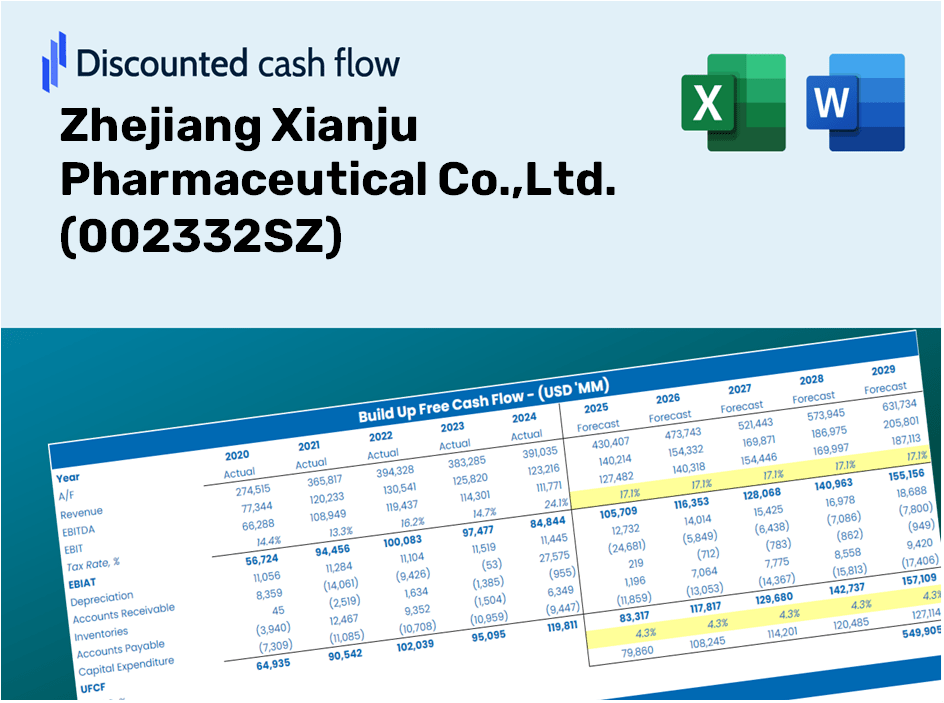
Zhejiang Xianju Pharmaceutical Co., Ltd. (002332.SZ) Avaliação DCF |
Totalmente Editável: Adapte-Se Às Suas Necessidades No Excel Ou Planilhas
Design Profissional: Modelos Confiáveis E Padrão Da Indústria
Pré-Construídos Para Uso Rápido E Eficiente
Compatível com MAC/PC, totalmente desbloqueado
Não É Necessária Experiência; Fácil De Seguir
Zhejiang Xianju Pharmaceutical Co.,Ltd. (002332.SZ) Bundle
Streamline Zhejiang Xianju Pharmaceutical Co., Ltd. (002332SZ) com esta calculadora DCF personalizável! Com a Real Zhejiang Xianju Pharmaceutical Co., Ltd. (002332SZ) e insumos de previsão ajustáveis, você pode explorar diferentes cenários e determinar o valor justo de Zhejiang Xianju Pharmaceutical Co., Ltd. (002333sz) em apenas minutos.
Discounted Cash Flow (DCF) - (USD MM)
| Year | AY1 2020 |
AY2 2021 |
AY3 2022 |
AY4 2023 |
AY5 2024 |
FY1 2025 |
FY2 2026 |
FY3 2027 |
FY4 2028 |
FY5 2029 |
|---|---|---|---|---|---|---|---|---|---|---|
| Revenue | 4,018.9 | 4,357.3 | 4,379.8 | 4,123.4 | 4,000.7 | 4,001.8 | 4,002.8 | 4,003.9 | 4,005.0 | 4,006.1 |
| Revenue Growth, % | 0 | 8.42 | 0.5159 | -5.85 | -2.98 | 0.02685447 | 0.02685447 | 0.02685447 | 0.02685447 | 0.02685447 |
| EBITDA | 817.2 | 857.1 | 866.3 | 816.2 | 835.2 | 804.0 | 804.2 | 804.4 | 804.6 | 804.9 |
| EBITDA, % | 20.33 | 19.67 | 19.78 | 19.8 | 20.88 | 20.09 | 20.09 | 20.09 | 20.09 | 20.09 |
| Depreciation | 177.1 | 184.2 | 187.5 | 211.5 | 217.8 | 188.0 | 188.0 | 188.1 | 188.1 | 188.2 |
| Depreciation, % | 4.41 | 4.23 | 4.28 | 5.13 | 5.44 | 4.7 | 4.7 | 4.7 | 4.7 | 4.7 |
| EBIT | 640.0 | 672.9 | 678.8 | 604.8 | 617.4 | 616.0 | 616.2 | 616.3 | 616.5 | 616.7 |
| EBIT, % | 15.93 | 15.44 | 15.5 | 14.67 | 15.43 | 15.39 | 15.39 | 15.39 | 15.39 | 15.39 |
| Total Cash | 1,437.6 | 1,767.6 | 1,720.5 | 1,660.0 | 1,381.9 | 1,524.0 | 1,524.4 | 1,524.9 | 1,525.3 | 1,525.7 |
| Total Cash, percent | .0 | .0 | .0 | .0 | .0 | .0 | .0 | .0 | .0 | .0 |
| Account Receivables | 963.4 | 752.2 | 798.5 | 741.8 | 902.5 | 800.5 | 800.7 | 800.9 | 801.1 | 801.4 |
| Account Receivables, % | 23.97 | 17.26 | 18.23 | 17.99 | 22.56 | 20 | 20 | 20 | 20 | 20 |
| Inventories | 725.7 | 888.5 | 890.5 | 922.9 | 930.9 | 835.8 | 836.0 | 836.2 | 836.5 | 836.7 |
| Inventories, % | 18.06 | 20.39 | 20.33 | 22.38 | 23.27 | 20.89 | 20.89 | 20.89 | 20.89 | 20.89 |
| Accounts Payable | 417.7 | 385.3 | 354.8 | 258.3 | 309.1 | 330.8 | 330.9 | 330.9 | 331.0 | 331.1 |
| Accounts Payable, % | 10.39 | 8.84 | 8.1 | 6.26 | 7.73 | 8.27 | 8.27 | 8.27 | 8.27 | 8.27 |
| Capital Expenditure | -118.2 | -266.8 | -282.5 | -234.6 | -207.6 | -211.2 | -211.3 | -211.4 | -211.4 | -211.5 |
| Capital Expenditure, % | -2.94 | -6.12 | -6.45 | -5.69 | -5.19 | -5.28 | -5.28 | -5.28 | -5.28 | -5.28 |
| Tax Rate, % | 20.3 | 20.3 | 20.3 | 20.3 | 20.3 | 20.3 | 20.3 | 20.3 | 20.3 | 20.3 |
| EBITAT | 519.8 | 571.0 | 583.4 | 530.7 | 492.1 | 516.8 | 516.9 | 517.1 | 517.2 | 517.4 |
| Depreciation | ||||||||||
| Changes in Account Receivables | ||||||||||
| Changes in Inventories | ||||||||||
| Changes in Accounts Payable | ||||||||||
| Capital Expenditure | ||||||||||
| UFCF | -692.7 | 504.3 | 409.5 | 435.4 | 384.4 | 712.3 | 493.3 | 493.4 | 493.6 | 493.7 |
| WACC, % | 4.7 | 4.7 | 4.7 | 4.7 | 4.69 | 4.7 | 4.7 | 4.7 | 4.7 | 4.7 |
| PV UFCF | ||||||||||
| SUM PV UFCF | 2,363.6 | |||||||||
| Long Term Growth Rate, % | 3.00 | |||||||||
| Free cash flow (T + 1) | 509 | |||||||||
| Terminal Value | 29,965 | |||||||||
| Present Terminal Value | 23,820 | |||||||||
| Enterprise Value | 26,184 | |||||||||
| Net Debt | -1,343 | |||||||||
| Equity Value | 27,526 | |||||||||
| Diluted Shares Outstanding, MM | 993 | |||||||||
| Equity Value Per Share | 27.72 |
What You Will Receive
- Customizable Excel Template: A fully adjustable Excel-based DCF Calculator featuring pre-filled financial data for Zhejiang Xianju Pharmaceutical Co., Ltd. (002332SZ).
- Authentic Financial Data: Access to historical figures and projected estimates (highlighted in the yellow cells).
- Adjustable Forecasts: Modify key assumptions such as revenue growth, EBITDA %, and WACC.
- Instant Calculations: Quickly observe how your inputs affect the valuation of Zhejiang Xianju Pharmaceutical Co., Ltd. (002332SZ).
- Professional Resource: Designed for investors, CFOs, consultants, and financial analysts.
- Intuitive Interface: Organized for simplicity and user-friendliness, complete with step-by-step guidance.
Key Features
- 🔍 Real-Life ZJP Financials: Pre-filled historical and projected data for Zhejiang Xianju Pharmaceutical Co., Ltd. (002332SZ).
- ✏️ Fully Customizable Inputs: Adjust all critical parameters (yellow cells) such as WACC, growth %, and tax rates.
- 📊 Professional DCF Valuation: Built-in formulas calculate the intrinsic value of Zhejiang Xianju using the Discounted Cash Flow method.
- ⚡ Instant Results: Visualize the valuation of Zhejiang Xianju immediately after making adjustments.
- Scenario Analysis: Test and compare outcomes for different financial assumptions side-by-side.
How It Operates
- Download: Obtain the pre-prepared Excel file containing Zhejiang Xianju Pharmaceutical Co., Ltd.’s financial data.
- Customize: Tailor your forecasts, including sales growth, EBITDA percentage, and WACC.
- Automatically Update: Intrinsic value and NPV calculations refresh in real-time.
- Scenario Testing: Generate various projections and compare results instantly.
- Make Informed Decisions: Utilize valuation outcomes to influence your investment strategy.
Why Opt for This Calculator?
- Designed for Experts: A sophisticated tool favored by analysts, CFOs, and industry consultants.
- Accurate Data Integration: Zhejiang Xianju Pharmaceutical Co., Ltd.'s historical and forecasted financial metrics are preloaded for precision.
- Forecast Simulation: Effortlessly test various scenarios and assumptions.
- Comprehensive Outputs: Automatically determines intrinsic value, NPV, and other essential metrics.
- User-Friendly: Intuitive, step-by-step instructions to facilitate your calculations.
Who Can Benefit from This Product?
- Pharmaceutical Students: Explore drug development processes and analyze real-world case studies.
- Researchers: Integrate industry-standard models into your projects and studies.
- Investors: Validate your predictions and examine valuation scenarios for Zhejiang Xianju Pharmaceutical Co.,Ltd. (002332SZ).
- Market Analysts: Enhance your analysis with a ready-to-use, customizable financial model.
- Entrepreneurs: Understand how major pharmaceutical companies like Zhejiang Xianju are evaluated and assessed.
Contents of the Template
- Operating and Balance Sheet Data: Pre-filled historical data and forecasts for Zhejiang Xianju Pharmaceutical Co., Ltd. (002332SZ), encompassing revenue, EBITDA, EBIT, and capital expenditures.
- WACC Calculation: A specific sheet for calculating the Weighted Average Cost of Capital (WACC), featuring parameters such as Beta, risk-free rate, and share price.
- DCF Valuation (Unlevered and Levered): Customizable Discounted Cash Flow models that present intrinsic value alongside detailed calculations.
- Financial Statements: Pre-loaded financial statements (annual and quarterly) designed to facilitate thorough analysis.
- Key Ratios: A collection of profitability, leverage, and efficiency ratios pertinent to Zhejiang Xianju Pharmaceutical Co., Ltd. (002332SZ).
- Dashboard and Charts: A visual overview of valuation outputs and assumptions to simplify the analysis of results.
Disclaimer
All information, articles, and product details provided on this website are for general informational and educational purposes only. We do not claim any ownership over, nor do we intend to infringe upon, any trademarks, copyrights, logos, brand names, or other intellectual property mentioned or depicted on this site. Such intellectual property remains the property of its respective owners, and any references here are made solely for identification or informational purposes, without implying any affiliation, endorsement, or partnership.
We make no representations or warranties, express or implied, regarding the accuracy, completeness, or suitability of any content or products presented. Nothing on this website should be construed as legal, tax, investment, financial, medical, or other professional advice. In addition, no part of this site—including articles or product references—constitutes a solicitation, recommendation, endorsement, advertisement, or offer to buy or sell any securities, franchises, or other financial instruments, particularly in jurisdictions where such activity would be unlawful.
All content is of a general nature and may not address the specific circumstances of any individual or entity. It is not a substitute for professional advice or services. Any actions you take based on the information provided here are strictly at your own risk. You accept full responsibility for any decisions or outcomes arising from your use of this website and agree to release us from any liability in connection with your use of, or reliance upon, the content or products found herein.