
|
S.F. Holding Co., Ltd. (002352.sz) Avaliação DCF |
Totalmente Editável: Adapte-Se Às Suas Necessidades No Excel Ou Planilhas
Design Profissional: Modelos Confiáveis E Padrão Da Indústria
Pré-Construídos Para Uso Rápido E Eficiente
Compatível com MAC/PC, totalmente desbloqueado
Não É Necessária Experiência; Fácil De Seguir
S.F. Holding Co., Ltd. (002352.SZ) Bundle
Otimize seu tempo e melhore a precisão com a nossa calculadora DCF (002352SZ)! Utilizando S.F. real Holding Co., Ltd. Dados e suposições personalizáveis, essa ferramenta permite que você preveja, analise e avalie S.F. Holding Co., Ltd. Como um investidor experiente.
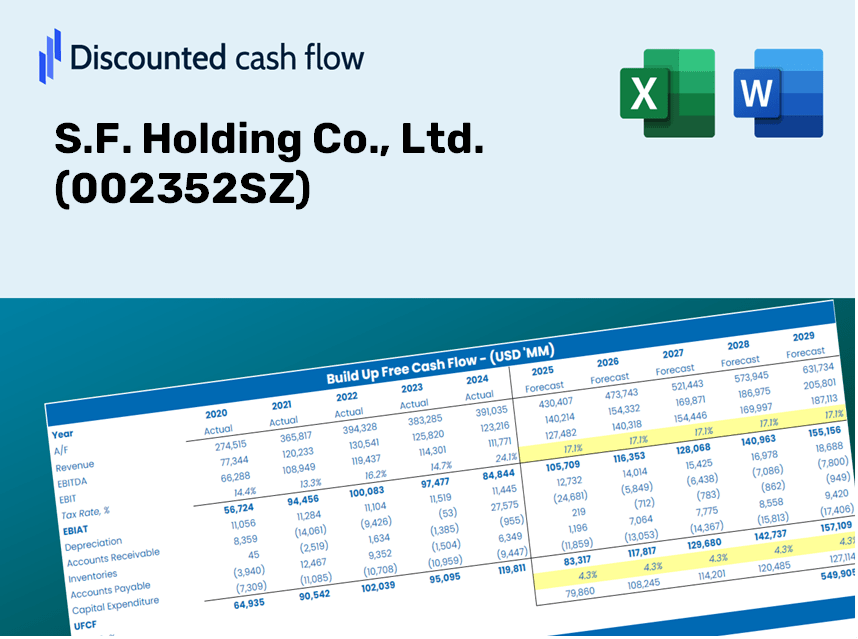
Discounted Cash Flow (DCF) - (USD MM)
| Year | AY1 2020 |
AY2 2021 |
AY3 2022 |
AY4 2023 |
AY5 2024 |
FY1 2025 |
FY2 2026 |
FY3 2027 |
FY4 2028 |
FY5 2029 |
|---|---|---|---|---|---|---|---|---|---|---|
| Revenue | 153,986.9 | 207,186.6 | 267,490.4 | 258,409.4 | 284,420.1 | 334,424.7 | 393,220.8 | 462,354.0 | 543,641.6 | 639,220.7 |
| Revenue Growth, % | 0 | 34.55 | 29.11 | -3.39 | 10.07 | 17.58 | 17.58 | 17.58 | 17.58 | 17.58 |
| EBITDA | 13,850.6 | 11,625.6 | 20,297.3 | 20,950.7 | 23,830.5 | 25,871.1 | 30,419.6 | 35,767.7 | 42,056.2 | 49,450.2 |
| EBITDA, % | 8.99 | 5.61 | 7.59 | 8.11 | 8.38 | 7.74 | 7.74 | 7.74 | 7.74 | 7.74 |
| Depreciation | 4,617.4 | 6,136.7 | 9,173.7 | 10,297.6 | 9,239.3 | 11,118.6 | 13,073.4 | 15,371.9 | 18,074.4 | 21,252.1 |
| Depreciation, % | 3 | 2.96 | 3.43 | 3.99 | 3.25 | 3.32 | 3.32 | 3.32 | 3.32 | 3.32 |
| EBIT | 9,233.3 | 5,488.9 | 11,123.6 | 10,653.0 | 14,591.2 | 14,752.5 | 17,346.2 | 20,395.9 | 23,981.7 | 28,198.0 |
| EBIT, % | 6 | 2.65 | 4.16 | 4.12 | 5.13 | 4.41 | 4.41 | 4.41 | 4.41 | 4.41 |
| Total Cash | 22,694.8 | 45,699.5 | 48,448.1 | 48,784.2 | 45,182.3 | 59,977.0 | 70,521.7 | 82,920.3 | 97,498.7 | 114,640.2 |
| Total Cash, percent | .0 | .0 | .0 | .0 | .0 | .0 | .0 | .0 | .0 | .0 |
| Account Receivables | 19,908.1 | 36,035.8 | 30,724.2 | 27,093.0 | 34,175.4 | 43,012.2 | 50,574.3 | 59,465.9 | 69,920.8 | 82,213.8 |
| Account Receivables, % | 12.93 | 17.39 | 11.49 | 10.48 | 12.02 | 12.86 | 12.86 | 12.86 | 12.86 | 12.86 |
| Inventories | 987.0 | 1,546.8 | 1,948.4 | 2,440.4 | 2,432.4 | 2,618.9 | 3,079.3 | 3,620.7 | 4,257.3 | 5,005.7 |
| Inventories, % | 0.64093 | 0.74658 | 0.72838 | 0.9444 | 0.85521 | 0.7831 | 0.7831 | 0.7831 | 0.7831 | 0.7831 |
| Accounts Payable | 15,484.9 | 23,467.7 | 24,748.1 | 24,914.3 | 27,395.5 | 33,381.1 | 39,249.9 | 46,150.6 | 54,264.4 | 63,804.8 |
| Accounts Payable, % | 10.06 | 11.33 | 9.25 | 9.64 | 9.63 | 9.98 | 9.98 | 9.98 | 9.98 | 9.98 |
| Capital Expenditure | -12,267.5 | -19,195.6 | -14,183.8 | -12,471.9 | -9,344.8 | -20,497.5 | -24,101.2 | -28,338.5 | -33,320.8 | -39,179.0 |
| Capital Expenditure, % | -7.97 | -9.26 | -5.3 | -4.83 | -3.29 | -6.13 | -6.13 | -6.13 | -6.13 | -6.13 |
| Tax Rate, % | 25.26 | 25.26 | 25.26 | 25.26 | 25.26 | 25.26 | 25.26 | 25.26 | 25.26 | 25.26 |
| EBITAT | 6,738.3 | 3,284.8 | 6,262.0 | 8,365.2 | 10,905.8 | 10,102.1 | 11,878.2 | 13,966.5 | 16,422.0 | 19,309.2 |
| Depreciation | ||||||||||
| Changes in Account Receivables | ||||||||||
| Changes in Inventories | ||||||||||
| Changes in Accounts Payable | ||||||||||
| Capital Expenditure | ||||||||||
| UFCF | -6,321.9 | -18,478.9 | 7,442.4 | 9,496.4 | 6,207.2 | -2,314.6 | -1,303.4 | -1,532.5 | -1,802.0 | -2,118.8 |
| WACC, % | 6.06 | 5.93 | 5.89 | 6.12 | 6.08 | 6.02 | 6.02 | 6.02 | 6.02 | 6.02 |
| PV UFCF | ||||||||||
| SUM PV UFCF | -7,637.3 | |||||||||
| Long Term Growth Rate, % | 3.50 | |||||||||
| Free cash flow (T + 1) | -2,193 | |||||||||
| Terminal Value | -87,102 | |||||||||
| Present Terminal Value | -65,033 | |||||||||
| Enterprise Value | -72,670 | |||||||||
| Net Debt | 22,905 | |||||||||
| Equity Value | -95,575 | |||||||||
| Diluted Shares Outstanding, MM | 4,820 | |||||||||
| Equity Value Per Share | -19.83 |
Benefits You'll Receive
- Adjustable Forecast Parameters: Effortlessly modify key assumptions (growth %, margins, WACC) to generate various scenarios.
- Real-World Financial Data: S.F. Holding Co., Ltd.’s financial metrics pre-loaded to enhance your analysis.
- Automated DCF Calculations: The template computes Net Present Value (NPV) and intrinsic value on your behalf.
- Customizable and Professional Design: A sleek Excel model that caters to your valuation requirements.
- Designed for Analysts and Investors: Perfect for evaluating projections, confirming strategies, and increasing efficiency.
Key Features
- Accurate Financial Data: Gain access to precise historical performance and future forecasts for S.F. Holding Co., Ltd. (002352SZ).
- Customizable Prediction Inputs: Modify the highlighted cells for assumptions like WACC, growth rates, and profit margins.
- Real-Time Calculations: Enjoy automatic updates for DCF, Net Present Value (NPV), and comprehensive cash flow analysis.
- User-Friendly Dashboard: Intuitive charts and summaries that make it easy to visualize your valuation outcomes.
- Designed for Everyone: A straightforward and user-friendly layout suitable for investors, CFOs, and consultants alike.
How It Operates
- Step 1: Download the Excel spreadsheet.
- Step 2: Examine the pre-filled data for S.F. Holding Co., Ltd. (002352SZ) (historical and forecasted).
- Step 3: Modify the key assumptions (highlighted in yellow) based on your evaluation.
- Step 4: Observe the automatic recalculations reflecting S.F. Holding Co., Ltd.’s (002352SZ) intrinsic value.
- Step 5: Utilize the results for investment strategies or reporting purposes.
Why Opt for This Calculator?
- User-Friendly Design: Perfectly crafted for both novices and seasoned professionals.
- Customizable Inputs: Effortlessly adjust assumptions to suit your analysis.
- Real-Time Updates: Instantly observe changes in S.F. Holding Co., Ltd.'s valuation as you tweak inputs.
- Ready-to-Analyze: Comes preloaded with S.F. Holding Co., Ltd. (002352SZ)'s financial data for immediate insights.
- Endorsed by Industry Experts: Favored by investors and analysts for making well-informed choices.
Who Should Consider This Product?
- Individual Investors: Gain insights to make informed decisions regarding the buying or selling of S.F. Holding Co., Ltd. (002352SZ) stock.
- Financial Analysts: Enhance valuation processes with readily available financial models tailored for S.F. Holding Co., Ltd. (002352SZ).
- Consultants: Provide clients with accurate and prompt valuation analysis of S.F. Holding Co., Ltd. (002352SZ).
- Business Owners: Learn how large corporations like S.F. Holding Co., Ltd. (002352SZ) are valued to inform your strategic decisions.
- Finance Students: Explore valuation methods employing real-world data and case studies related to S.F. Holding Co., Ltd. (002352SZ).
What the Template Includes
- Preloaded S.F. Holding Data: Historical and projected financial metrics, encompassing revenue, EBIT, and capital expenditures.
- DCF and WACC Models: High-quality spreadsheets designed for calculating intrinsic value and Weighted Average Cost of Capital.
- Editable Inputs: Cells highlighted in yellow for customizing revenue growth, tax rates, and discount rates.
- Financial Statements: Detailed annual and quarterly financials for in-depth analysis.
- Key Ratios: Profitability, leverage, and efficiency ratios to assess performance.
- Dashboard and Charts: Visual representations of valuation results and underlying assumptions.
Disclaimer
All information, articles, and product details provided on this website are for general informational and educational purposes only. We do not claim any ownership over, nor do we intend to infringe upon, any trademarks, copyrights, logos, brand names, or other intellectual property mentioned or depicted on this site. Such intellectual property remains the property of its respective owners, and any references here are made solely for identification or informational purposes, without implying any affiliation, endorsement, or partnership.
We make no representations or warranties, express or implied, regarding the accuracy, completeness, or suitability of any content or products presented. Nothing on this website should be construed as legal, tax, investment, financial, medical, or other professional advice. In addition, no part of this site—including articles or product references—constitutes a solicitation, recommendation, endorsement, advertisement, or offer to buy or sell any securities, franchises, or other financial instruments, particularly in jurisdictions where such activity would be unlawful.
All content is of a general nature and may not address the specific circumstances of any individual or entity. It is not a substitute for professional advice or services. Any actions you take based on the information provided here are strictly at your own risk. You accept full responsibility for any decisions or outcomes arising from your use of this website and agree to release us from any liability in connection with your use of, or reliance upon, the content or products found herein.