
|
Visionox Technology Inc. (002387.sz) Avaliação DCF |
Totalmente Editável: Adapte-Se Às Suas Necessidades No Excel Ou Planilhas
Design Profissional: Modelos Confiáveis E Padrão Da Indústria
Pré-Construídos Para Uso Rápido E Eficiente
Compatível com MAC/PC, totalmente desbloqueado
Não É Necessária Experiência; Fácil De Seguir
Visionox Technology Inc. (002387.SZ) Bundle
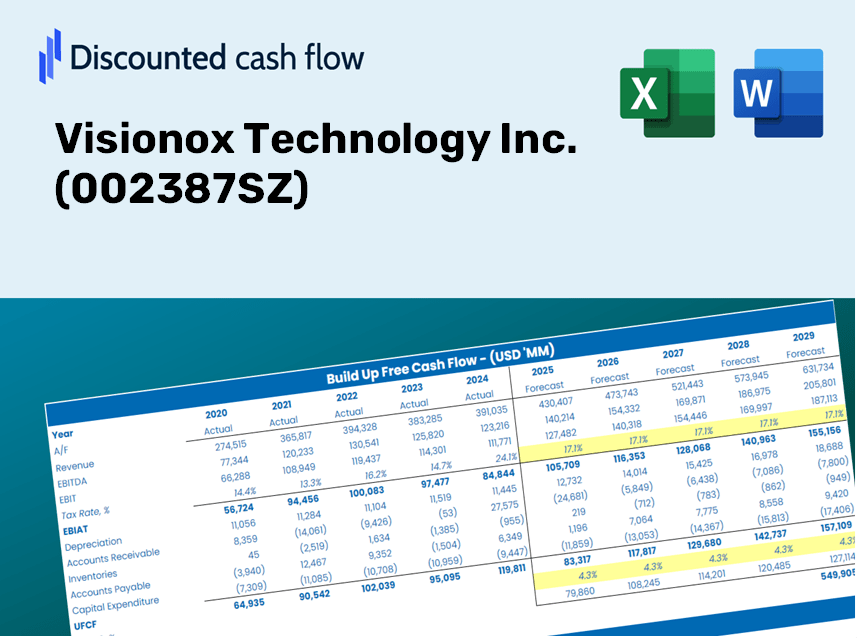
Streamline Visionox Technology Inc. (002387SZ) Avaliação com esta calculadora DCF personalizável! Incorporando o Real Visionox Technology Inc. (002387SZ) Financeiras e insumos de previsão ajustáveis, você pode experimentar cenários e descobrir o valor justo Visionox Technology Inc. (002387SZ) em apenas alguns minutos.
Discounted Cash Flow (DCF) - (USD MM)
| Year | AY1 2020 |
AY2 2021 |
AY3 2022 |
AY4 2023 |
AY5 2024 |
FY1 2025 |
FY2 2026 |
FY3 2027 |
FY4 2028 |
FY5 2029 |
|---|---|---|---|---|---|---|---|---|---|---|
| Revenue | 3,434.3 | 6,214.4 | 7,476.7 | 5,925.7 | 7,928.7 | 10,194.6 | 13,108.2 | 16,854.5 | 21,671.4 | 27,865.0 |
| Revenue Growth, % | 0 | 80.95 | 20.31 | -20.74 | 33.8 | 28.58 | 28.58 | 28.58 | 28.58 | 28.58 |
| EBITDA | 286.7 | -213.3 | -181.4 | -1,811.4 | -248.7 | -636.5 | -818.4 | -1,052.2 | -1,353.0 | -1,739.6 |
| EBITDA, % | 8.35 | -3.43 | -2.43 | -30.57 | -3.14 | -6.24 | -6.24 | -6.24 | -6.24 | -6.24 |
| Depreciation | 770.4 | 1,571.5 | 2,284.5 | 2,352.6 | 2,353.6 | 3,010.7 | 3,871.2 | 4,977.5 | 6,400.1 | 8,229.2 |
| Depreciation, % | 22.43 | 25.29 | 30.56 | 39.7 | 29.68 | 29.53 | 29.53 | 29.53 | 29.53 | 29.53 |
| EBIT | -483.7 | -1,784.8 | -2,466.0 | -4,164.0 | -2,602.3 | -3,647.2 | -4,689.5 | -6,029.8 | -7,753.0 | -9,968.8 |
| EBIT, % | -14.09 | -28.72 | -32.98 | -70.27 | -32.82 | -35.78 | -35.78 | -35.78 | -35.78 | -35.78 |
| Total Cash | 3,466.6 | 4,019.6 | 6,485.7 | 6,692.0 | 5,903.2 | 8,683.4 | 11,165.1 | 14,356.0 | 18,458.9 | 23,734.4 |
| Total Cash, percent | .0 | .0 | .0 | .0 | .0 | .0 | .0 | .0 | .0 | .0 |
| Account Receivables | 525.7 | 2,562.8 | 2,784.2 | 2,353.7 | 3,961.5 | 3,740.8 | 4,809.9 | 6,184.5 | 7,952.0 | 10,224.6 |
| Account Receivables, % | 15.31 | 41.24 | 37.24 | 39.72 | 49.96 | 36.69 | 36.69 | 36.69 | 36.69 | 36.69 |
| Inventories | 520.5 | 921.2 | 833.8 | 495.5 | 635.4 | 1,172.5 | 1,507.6 | 1,938.5 | 2,492.5 | 3,204.9 |
| Inventories, % | 15.16 | 14.82 | 11.15 | 8.36 | 8.01 | 11.5 | 11.5 | 11.5 | 11.5 | 11.5 |
| Accounts Payable | 4,093.0 | 3,976.4 | 5,891.5 | 6,978.0 | 8,997.4 | 9,028.1 | 11,608.3 | 14,925.8 | 19,191.6 | 24,676.4 |
| Accounts Payable, % | 119.18 | 63.99 | 78.8 | 117.76 | 113.48 | 88.56 | 88.56 | 88.56 | 88.56 | 88.56 |
| Capital Expenditure | -2,410.5 | -820.9 | -1,149.5 | -1,462.1 | -959.6 | -2,763.7 | -3,553.6 | -4,569.2 | -5,875.1 | -7,554.1 |
| Capital Expenditure, % | -70.19 | -13.21 | -15.37 | -24.67 | -12.1 | -27.11 | -27.11 | -27.11 | -27.11 | -27.11 |
| Tax Rate, % | 18.19 | 18.19 | 18.19 | 18.19 | 18.19 | 18.19 | 18.19 | 18.19 | 18.19 | 18.19 |
| EBITAT | -342.5 | -1,200.2 | -1,604.8 | -3,073.9 | -2,128.9 | -2,616.9 | -3,364.8 | -4,326.5 | -5,563.0 | -7,152.8 |
| Depreciation | ||||||||||
| Changes in Account Receivables | ||||||||||
| Changes in Inventories | ||||||||||
| Changes in Accounts Payable | ||||||||||
| Capital Expenditure | ||||||||||
| UFCF | 1,064.3 | -3,004.1 | 1,311.4 | -328.2 | -463.2 | -2,655.7 | -1,871.3 | -2,406.1 | -3,093.7 | -3,977.9 |
| WACC, % | 5.26 | 5.11 | 5.02 | 5.39 | 5.73 | 5.3 | 5.3 | 5.3 | 5.3 | 5.3 |
| PV UFCF | ||||||||||
| SUM PV UFCF | -11,858.2 | |||||||||
| Long Term Growth Rate, % | 2.00 | |||||||||
| Free cash flow (T + 1) | -4,057 | |||||||||
| Terminal Value | -122,825 | |||||||||
| Present Terminal Value | -94,858 | |||||||||
| Enterprise Value | -106,717 | |||||||||
| Net Debt | 5,818 | |||||||||
| Equity Value | -112,535 | |||||||||
| Diluted Shares Outstanding, MM | 1,386 | |||||||||
| Equity Value Per Share | -81.21 |
What You Will Receive
- Comprehensive Visionox Financials: Access both historical data and projections for precise valuation.
- Customizable Parameters: Adjust WACC, tax rates, revenue growth, and capital expenditures to fit your analysis.
- Automated Calculations: Intrinsic value and NPV computed in real-time.
- Scenario Analysis: Explore various scenarios to assess the future performance of Visionox.
- User-Friendly Interface: Designed for professionals while remaining easy enough for newcomers.
Key Features
- Comprehensive Visionox Data: Equipped with historical financial performance and future projections for Visionox Technology Inc. (002387SZ).
- Customizable Inputs: Modify parameters such as revenue growth, profit margins, WACC, tax rates, and capital expenditures to fit your analysis.
- Interactive Valuation Model: Automatically refreshes Net Present Value (NPV) and intrinsic value in response to your adjustments.
- Scenario Analysis: Develop various forecast scenarios to explore different valuation possibilities.
- User-Friendly Interface: Intuitive, organized, and suitable for both experts and novices.
How It Works
- Step 1: Download the prebuilt Excel template featuring Visionox Technology Inc. (002387SZ) data.
- Step 2: Review the pre-filled sheets to familiarize yourself with the essential metrics.
- Step 3: Modify forecasts and assumptions in the editable yellow cells (WACC, growth, margins).
- Step 4: Instantly see the recalculated results, including the intrinsic value of Visionox Technology Inc. (002387SZ).
- Step 5: Use the outputs to make informed investment decisions or create detailed reports.
Why Opt for This Calculator for Visionox Technology Inc. (002387SZ)?
- All-in-One Tool: Seamlessly integrates DCF, WACC, and financial ratio analyses.
- Customizable Features: Modify the yellow-highlighted cells to explore different scenarios.
- In-Depth Analysis: Automatically computes Visionox’s intrinsic value and Net Present Value.
- Preloaded Information: Comes equipped with historical and projected data for reliable analysis.
- High-Quality Standards: Perfectly tailored for financial analysts, investors, and business consultants.
Who Can Benefit from Visionox Technology Inc. (002387SZ)?
- Individual Investors: Make informed choices regarding the purchase or sale of Visionox stock.
- Financial Analysts: Optimize valuation procedures with accessible financial models tailored for Visionox.
- Consultants: Provide clients with precise and rapid valuation insights related to Visionox Technology.
- Business Owners: Gain insights into how major firms like Visionox are appraised to inform your own business strategy.
- Finance Students: Master valuation methodologies using real-life data and examples from Visionox Technology Inc.
What the Template Contains
- Historical Data: Comprehensive overview of Visionox Technology Inc.'s past financial performance and baseline projections.
- DCF and Levered DCF Models: Detailed templates designed to calculate the intrinsic value of Visionox Technology Inc. (002387SZ).
- WACC Sheet: Pre-configured calculations for the Weighted Average Cost of Capital.
- Editable Inputs: Customize key drivers such as growth rates, EBITDA %, and CAPEX assumptions.
- Quarterly and Annual Statements: A thorough analysis of Visionox Technology Inc.'s financial statements.
- Interactive Dashboard: Dynamically visualize valuation results and forecasts.
Disclaimer
All information, articles, and product details provided on this website are for general informational and educational purposes only. We do not claim any ownership over, nor do we intend to infringe upon, any trademarks, copyrights, logos, brand names, or other intellectual property mentioned or depicted on this site. Such intellectual property remains the property of its respective owners, and any references here are made solely for identification or informational purposes, without implying any affiliation, endorsement, or partnership.
We make no representations or warranties, express or implied, regarding the accuracy, completeness, or suitability of any content or products presented. Nothing on this website should be construed as legal, tax, investment, financial, medical, or other professional advice. In addition, no part of this site—including articles or product references—constitutes a solicitation, recommendation, endorsement, advertisement, or offer to buy or sell any securities, franchises, or other financial instruments, particularly in jurisdictions where such activity would be unlawful.
All content is of a general nature and may not address the specific circumstances of any individual or entity. It is not a substitute for professional advice or services. Any actions you take based on the information provided here are strictly at your own risk. You accept full responsibility for any decisions or outcomes arising from your use of this website and agree to release us from any liability in connection with your use of, or reliance upon, the content or products found herein.