
|
Navinfo Co., Ltd. (002405.sz) Avaliação DCF |
Totalmente Editável: Adapte-Se Às Suas Necessidades No Excel Ou Planilhas
Design Profissional: Modelos Confiáveis E Padrão Da Indústria
Pré-Construídos Para Uso Rápido E Eficiente
Compatível com MAC/PC, totalmente desbloqueado
Não É Necessária Experiência; Fácil De Seguir
NavInfo Co., Ltd. (002405.SZ) Bundle
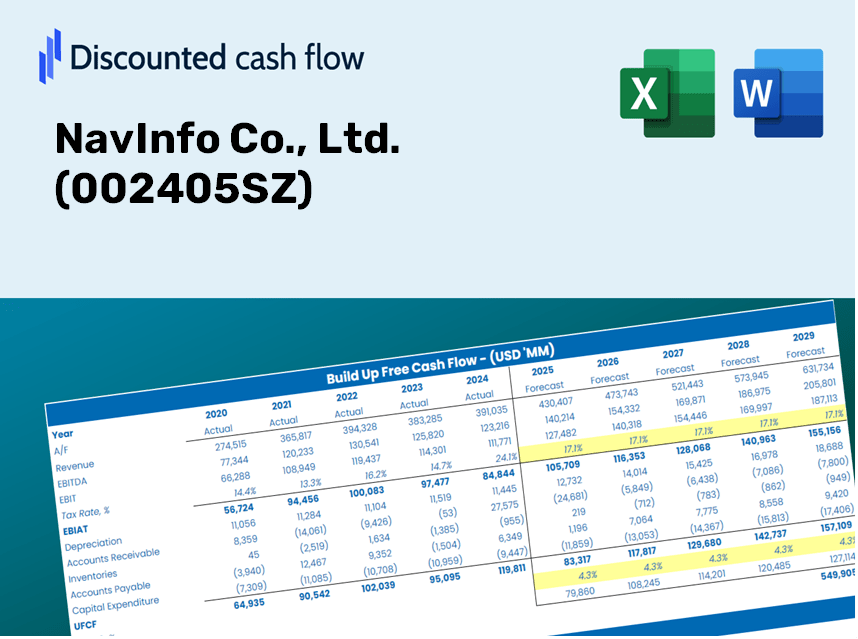
Descubra o verdadeiro potencial da Navinfo Co., Ltd. (002405SZ) com nossa calculadora DCF avançada! Ajuste as principais suposições, explore vários cenários e avalie como as mudanças afetam a avaliação da Navinfo Co., Ltd. (002405SZ) - tudo dentro de um único modelo do Excel.
Discounted Cash Flow (DCF) - (USD MM)
| Year | AY1 2020 |
AY2 2021 |
AY3 2022 |
AY4 2023 |
AY5 2024 |
FY1 2025 |
FY2 2026 |
FY3 2027 |
FY4 2028 |
FY5 2029 |
|---|---|---|---|---|---|---|---|---|---|---|
| Revenue | 2,147.7 | 3,060.0 | 3,346.8 | 3,121.8 | 3,517.7 | 4,026.1 | 4,608.0 | 5,274.0 | 6,036.3 | 6,908.8 |
| Revenue Growth, % | 0 | 42.48 | 9.37 | -6.72 | 12.68 | 14.45 | 14.45 | 14.45 | 14.45 | 14.45 |
| EBITDA | 59.7 | 343.3 | -238.4 | -1,006.6 | -592.4 | -339.9 | -389.0 | -445.2 | -509.6 | -583.2 |
| EBITDA, % | 2.78 | 11.22 | -7.12 | -32.25 | -16.84 | -8.44 | -8.44 | -8.44 | -8.44 | -8.44 |
| Depreciation | 206.4 | 250.9 | 299.2 | 313.8 | 172.4 | 335.8 | 384.3 | 439.9 | 503.4 | 576.2 |
| Depreciation, % | 9.61 | 8.2 | 8.94 | 10.05 | 4.9 | 8.34 | 8.34 | 8.34 | 8.34 | 8.34 |
| EBIT | -146.7 | 92.4 | -537.6 | -1,320.5 | -764.8 | -675.7 | -773.3 | -885.1 | -1,013.0 | -1,159.4 |
| EBIT, % | -6.83 | 3.02 | -16.06 | -42.3 | -21.74 | -16.78 | -16.78 | -16.78 | -16.78 | -16.78 |
| Total Cash | 1,450.6 | 5,380.2 | 4,168.1 | 3,176.6 | 2,576.7 | 3,549.4 | 4,062.4 | 4,649.5 | 5,321.5 | 6,090.7 |
| Total Cash, percent | .0 | .0 | .0 | .0 | .0 | .0 | .0 | .0 | .0 | .0 |
| Account Receivables | 1,037.1 | 1,071.0 | 1,210.2 | 1,272.7 | 1,142.6 | 1,551.6 | 1,775.9 | 2,032.6 | 2,326.3 | 2,662.6 |
| Account Receivables, % | 48.29 | 35 | 36.16 | 40.77 | 32.48 | 38.54 | 38.54 | 38.54 | 38.54 | 38.54 |
| Inventories | 157.4 | 368.0 | 695.2 | 879.9 | 828.4 | 739.7 | 846.6 | 969.0 | 1,109.0 | 1,269.3 |
| Inventories, % | 7.33 | 12.02 | 20.77 | 28.19 | 23.55 | 18.37 | 18.37 | 18.37 | 18.37 | 18.37 |
| Accounts Payable | 301.3 | 420.1 | 811.4 | 1,063.6 | 559.3 | 821.1 | 939.8 | 1,075.6 | 1,231.1 | 1,409.0 |
| Accounts Payable, % | 14.03 | 13.73 | 24.24 | 34.07 | 15.9 | 20.39 | 20.39 | 20.39 | 20.39 | 20.39 |
| Capital Expenditure | -290.2 | -627.3 | -601.8 | -456.9 | -390.0 | -625.8 | -716.2 | -819.8 | -938.2 | -1,073.8 |
| Capital Expenditure, % | -13.51 | -20.5 | -17.98 | -14.64 | -11.09 | -15.54 | -15.54 | -15.54 | -15.54 | -15.54 |
| Tax Rate, % | 3.52 | 3.52 | 3.52 | 3.52 | 3.52 | 3.52 | 3.52 | 3.52 | 3.52 | 3.52 |
| EBITAT | -130.3 | 83.0 | -355.1 | -1,260.2 | -737.8 | -590.0 | -675.3 | -772.9 | -884.6 | -1,012.4 |
| Depreciation | ||||||||||
| Changes in Account Receivables | ||||||||||
| Changes in Inventories | ||||||||||
| Changes in Accounts Payable | ||||||||||
| Capital Expenditure | ||||||||||
| UFCF | -1,107.2 | -419.2 | -732.9 | -1,398.3 | -1,278.2 | -938.5 | -1,219.7 | -1,396.0 | -1,597.7 | -1,828.6 |
| WACC, % | 5.4 | 5.4 | 5.37 | 5.4 | 5.4 | 5.39 | 5.39 | 5.39 | 5.39 | 5.39 |
| PV UFCF | ||||||||||
| SUM PV UFCF | -5,881.9 | |||||||||
| Long Term Growth Rate, % | 2.00 | |||||||||
| Free cash flow (T + 1) | -1,865 | |||||||||
| Terminal Value | -54,949 | |||||||||
| Present Terminal Value | -42,255 | |||||||||
| Enterprise Value | -48,137 | |||||||||
| Net Debt | -1,888 | |||||||||
| Equity Value | -46,248 | |||||||||
| Diluted Shares Outstanding, MM | 2,343 | |||||||||
| Equity Value Per Share | -19.74 |
Benefits You Will Receive
- Comprehensive NavInfo Financials: Access both historical and forecasted data for precise valuation.
- Customizable Inputs: Adjust WACC, tax rates, revenue growth, and capital expenditures to suit your analysis.
- Automated Calculations: Receive real-time calculations of intrinsic value and NPV.
- Scenario Analysis: Explore various scenarios to assess the future performance of NavInfo (002405SZ).
- User-Friendly Design: Crafted for industry professionals while remaining easy for newcomers.
Key Features
- 🔍 Real-Life NavInfo Financials: Pre-filled historical and projected data for NavInfo Co., Ltd. (002405SZ).
- ✏️ Fully Customizable Inputs: Modify all essential parameters (highlighted cells) such as WACC, growth %, and tax rates.
- 📊 Professional DCF Valuation: Integrated formulas calculate NavInfo’s intrinsic value using the Discounted Cash Flow method.
- ⚡ Instant Results: Visualize NavInfo’s valuation immediately after adjustments.
- Scenario Analysis: Evaluate and compare various financial assumptions side-by-side.
How It Works
- Download: Get the pre-prepared Excel file containing NavInfo Co., Ltd.’s (002405SZ) financial data.
- Customize: Modify projections, including revenue growth, EBITDA %, and WACC.
- Update Automatically: Intrinsic value and NPV calculations refresh in real-time.
- Test Scenarios: Generate various forecasts and instantly compare outcomes.
- Make Decisions: Utilize the valuation insights to inform your investment approach.
Who Can Benefit from NavInfo Co., Ltd. (002405SZ)?
- Individual Investors: Gain insights to make educated decisions about purchasing or selling shares of NavInfo Co., Ltd. (002405SZ).
- Financial Analysts: Enhance valuation tasks with accessible and effective financial models specific to NavInfo Co., Ltd. (002405SZ).
- Consultants: Provide clients with timely and precise valuation analyses regarding NavInfo Co., Ltd. (002405SZ).
- Business Owners: Learn how companies like NavInfo Co., Ltd. (002405SZ) are valued to refine your own business strategy.
- Finance Students: Explore valuation methodologies using data and case studies from NavInfo Co., Ltd. (002405SZ).
Overview of Template Features for NavInfo Co., Ltd. (002405SZ)
- Historical Data: Contains past financial performance and foundational forecasts for NavInfo.
- DCF and Levered DCF Models: Comprehensive templates designed to assess NavInfo’s intrinsic value.
- WACC Sheet: Pre-calculated metrics for the Weighted Average Cost of Capital.
- Editable Inputs: Adjust critical parameters such as growth rates, EBITDA percentages, and CAPEX projections.
- Quarterly and Annual Statements: In-depth analysis of NavInfo's financial data.
- Interactive Dashboard: Dynamically visualize valuation outcomes and future forecasts.
Disclaimer
All information, articles, and product details provided on this website are for general informational and educational purposes only. We do not claim any ownership over, nor do we intend to infringe upon, any trademarks, copyrights, logos, brand names, or other intellectual property mentioned or depicted on this site. Such intellectual property remains the property of its respective owners, and any references here are made solely for identification or informational purposes, without implying any affiliation, endorsement, or partnership.
We make no representations or warranties, express or implied, regarding the accuracy, completeness, or suitability of any content or products presented. Nothing on this website should be construed as legal, tax, investment, financial, medical, or other professional advice. In addition, no part of this site—including articles or product references—constitutes a solicitation, recommendation, endorsement, advertisement, or offer to buy or sell any securities, franchises, or other financial instruments, particularly in jurisdictions where such activity would be unlawful.
All content is of a general nature and may not address the specific circumstances of any individual or entity. It is not a substitute for professional advice or services. Any actions you take based on the information provided here are strictly at your own risk. You accept full responsibility for any decisions or outcomes arising from your use of this website and agree to release us from any liability in connection with your use of, or reliance upon, the content or products found herein.