
|
Zibo Qixiang Tengda Chemical Co., Ltd (002408.sz) DCF Avaliação |
Totalmente Editável: Adapte-Se Às Suas Necessidades No Excel Ou Planilhas
Design Profissional: Modelos Confiáveis E Padrão Da Indústria
Pré-Construídos Para Uso Rápido E Eficiente
Compatível com MAC/PC, totalmente desbloqueado
Não É Necessária Experiência; Fácil De Seguir
Zibo Qixiang Tengda Chemical Co., Ltd (002408.SZ) Bundle
Simplifique sua análise e melhore a precisão com a nossa calculadora DCF (002408SZ)! Utilizando dados reais da Zibo Qixiang Tengda Chemical Co., LTD e suposições personalizáveis, essa ferramenta o capacita a prever, analisar e valorizar Zibo Qixiang Tengda como um investidor experiente.
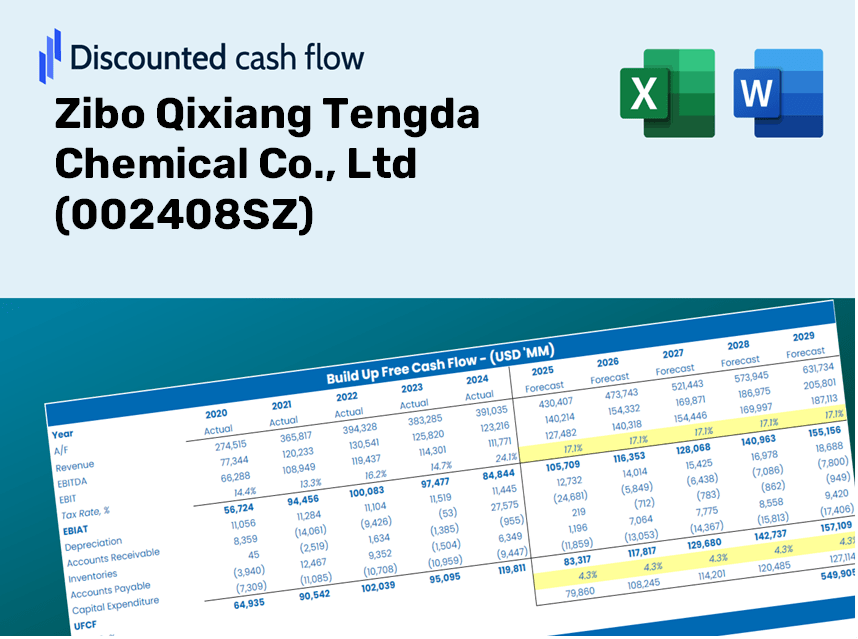
Discounted Cash Flow (DCF) - (USD MM)
| Year | AY1 2020 |
AY2 2021 |
AY3 2022 |
AY4 2023 |
AY5 2024 |
FY1 2025 |
FY2 2026 |
FY3 2027 |
FY4 2028 |
FY5 2029 |
|---|---|---|---|---|---|---|---|---|---|---|
| Revenue | 24,685.9 | 34,892.1 | 29,810.5 | 26,918.5 | 25,218.8 | 29,299.6 | 34,040.6 | 39,548.9 | 45,948.4 | 53,383.4 |
| Revenue Growth, % | 0 | 41.34 | -14.56 | -9.7 | -6.31 | 16.18 | 16.18 | 16.18 | 16.18 | 16.18 |
| EBITDA | 2,202.9 | 4,152.3 | 2,324.6 | 2,235.8 | 1,974.4 | 2,622.7 | 3,047.1 | 3,540.2 | 4,113.0 | 4,778.5 |
| EBITDA, % | 8.92 | 11.9 | 7.8 | 8.31 | 7.83 | 8.95 | 8.95 | 8.95 | 8.95 | 8.95 |
| Depreciation | 775.3 | 1,042.5 | 1,216.1 | 1,785.1 | 1,730.3 | 1,388.8 | 1,613.6 | 1,874.7 | 2,178.0 | 2,530.5 |
| Depreciation, % | 3.14 | 2.99 | 4.08 | 6.63 | 6.86 | 4.74 | 4.74 | 4.74 | 4.74 | 4.74 |
| EBIT | 1,427.5 | 3,109.8 | 1,108.5 | 450.7 | 244.1 | 1,233.9 | 1,433.5 | 1,665.5 | 1,935.0 | 2,248.1 |
| EBIT, % | 5.78 | 8.91 | 3.72 | 1.67 | 0.96773 | 4.21 | 4.21 | 4.21 | 4.21 | 4.21 |
| Total Cash | 4,639.1 | 2,605.6 | 2,610.6 | 3,112.4 | 2,904.9 | 3,404.5 | 3,955.4 | 4,595.4 | 5,339.0 | 6,203.0 |
| Total Cash, percent | .0 | .0 | .0 | .0 | .0 | .0 | .0 | .0 | .0 | .0 |
| Account Receivables | 2,482.6 | 4,276.7 | 4,626.5 | 2,035.7 | 2,277.1 | 3,189.3 | 3,705.3 | 4,304.9 | 5,001.5 | 5,810.8 |
| Account Receivables, % | 10.06 | 12.26 | 15.52 | 7.56 | 9.03 | 10.89 | 10.89 | 10.89 | 10.89 | 10.89 |
| Inventories | 759.8 | 1,194.7 | 1,476.6 | 1,763.6 | 1,184.8 | 1,330.5 | 1,545.8 | 1,795.9 | 2,086.5 | 2,424.1 |
| Inventories, % | 3.08 | 3.42 | 4.95 | 6.55 | 4.7 | 4.54 | 4.54 | 4.54 | 4.54 | 4.54 |
| Accounts Payable | 2,336.0 | 2,187.6 | 3,694.9 | 1,898.2 | 1,468.1 | 2,402.6 | 2,791.4 | 3,243.0 | 3,767.8 | 4,377.5 |
| Accounts Payable, % | 9.46 | 6.27 | 12.39 | 7.05 | 5.82 | 8.2 | 8.2 | 8.2 | 8.2 | 8.2 |
| Capital Expenditure | -2,165.5 | -5,781.7 | -4,632.8 | -2,312.7 | -752.8 | -3,074.1 | -3,571.5 | -4,149.5 | -4,820.9 | -5,601.0 |
| Capital Expenditure, % | -8.77 | -16.57 | -15.54 | -8.59 | -2.99 | -10.49 | -10.49 | -10.49 | -10.49 | -10.49 |
| Tax Rate, % | 39.02 | 39.02 | 39.02 | 39.02 | 39.02 | 39.02 | 39.02 | 39.02 | 39.02 | 39.02 |
| EBITAT | 1,153.3 | 2,651.8 | 978.7 | 338.1 | 148.8 | 963.3 | 1,119.2 | 1,300.2 | 1,510.6 | 1,755.1 |
| Depreciation | ||||||||||
| Changes in Account Receivables | ||||||||||
| Changes in Inventories | ||||||||||
| Changes in Accounts Payable | ||||||||||
| Capital Expenditure | ||||||||||
| UFCF | -1,143.3 | -4,464.7 | -1,562.5 | 317.7 | 1,033.6 | -845.4 | -1,181.4 | -1,372.6 | -1,594.7 | -1,852.7 |
| WACC, % | 5.14 | 5.21 | 5.26 | 5.06 | 4.85 | 5.1 | 5.1 | 5.1 | 5.1 | 5.1 |
| PV UFCF | ||||||||||
| SUM PV UFCF | -5,807.2 | |||||||||
| Long Term Growth Rate, % | 3.50 | |||||||||
| Free cash flow (T + 1) | -1,918 | |||||||||
| Terminal Value | -119,594 | |||||||||
| Present Terminal Value | -93,245 | |||||||||
| Enterprise Value | -99,052 | |||||||||
| Net Debt | 6,946 | |||||||||
| Equity Value | -105,998 | |||||||||
| Diluted Shares Outstanding, MM | 2,820 | |||||||||
| Equity Value Per Share | -37.59 |
Benefits You'll Receive
- Pre-Filled Financial Model: Utilize Zibo Qixiang Tengda Chemical's actual data for accurate DCF valuation.
- Comprehensive Forecast Control: Modify revenue growth, profit margins, WACC, and other crucial drivers.
- Instantaneous Calculations: Real-time updates provide you with immediate results as you adjust parameters.
- Investor-Ready Template: A polished Excel file specifically created for top-tier valuation standards.
- Flexible and Reusable: Designed for adaptability, making it suitable for repeated detailed forecasts.
Key Features
- Accurate Financial Data for Zibo Qixiang Tengda Chemical: Gain access to reliable historical data and forward-looking projections for (002408SZ).
- Adjustable Forecast Parameters: Modify highlighted cells for key metrics such as WACC, growth rates, and profit margins.
- Real-time Calculations: Automated updates to Discounted Cash Flow (DCF), Net Present Value (NPV), and cash flow analysis.
- User-Friendly Dashboard: Clear charts and summaries designed to effectively display your valuation findings.
- Designed for All Experience Levels: An accessible, intuitive layout tailored for investors, CFOs, and consultants alike.
How It Functions
- Download: Obtain the pre-formatted Excel file containing Zibo Qixiang Tengda Chemical Co., Ltd’s (002408SZ) financial data.
- Customize: Modify projections such as revenue growth, EBITDA percentage, and WACC as needed.
- Real-Time Updates: The intrinsic value and NPV calculations refresh automatically with your inputs.
- Test Scenarios: Develop various projections and analyze results side-by-side instantly.
- Make Informed Choices: Leverage the valuation outputs to shape your investment strategies.
Why Opt for This Calculator?
- Designed for Experts: A sophisticated tool trusted by analysts, CFOs, and consultants in the industry.
- Accurate Data: Zibo Qixiang Tengda Chemical Co., Ltd’s historical and projected financial information is preloaded for precise analysis.
- Forecast Simulations: Effortlessly test various scenarios and assumptions to gauge potential outcomes.
- Comprehensive Outputs: Instantly calculates intrinsic value, NPV, and vital financial metrics.
- User-Friendly: Step-by-step guidance ensures a smooth experience throughout the process.
Who Should Consider This Product?
- Individual Investors: Make informed choices regarding the purchase or sale of Zibo Qixiang Tengda Chemical Co., Ltd (002408SZ) stock.
- Financial Analysts: Enhance valuation methods with convenient financial models tailored for Zibo Qixiang Tengda Chemical Co., Ltd (002408SZ).
- Consultants: Provide accurate and timely valuation insights for clients interested in Zibo Qixiang Tengda Chemical Co., Ltd (002408SZ).
- Business Owners: Gain insights into how large firms like Zibo Qixiang Tengda Chemical Co., Ltd (002408SZ) are valued to inform your own business strategies.
- Finance Students: Explore valuation methodologies using real-world examples and data related to Zibo Qixiang Tengda Chemical Co., Ltd (002408SZ).
Contents of the Template
- Comprehensive DCF Model: Editable template featuring thorough valuation calculations.
- Real-World Data: Historical and projected financials of Zibo Qixiang Tengda Chemical Co., Ltd (002408SZ) included for analysis.
- Customizable Parameters: Modify WACC, growth rates, and tax assumptions to explore various scenarios.
- Financial Statements: Complete annual and quarterly reports for detailed insights.
- Key Ratios: Integrated analysis for assessing profitability, efficiency, and leverage.
- Dashboard with Visual Outputs: Visuals like charts and tables to present clear, actionable results.
Disclaimer
All information, articles, and product details provided on this website are for general informational and educational purposes only. We do not claim any ownership over, nor do we intend to infringe upon, any trademarks, copyrights, logos, brand names, or other intellectual property mentioned or depicted on this site. Such intellectual property remains the property of its respective owners, and any references here are made solely for identification or informational purposes, without implying any affiliation, endorsement, or partnership.
We make no representations or warranties, express or implied, regarding the accuracy, completeness, or suitability of any content or products presented. Nothing on this website should be construed as legal, tax, investment, financial, medical, or other professional advice. In addition, no part of this site—including articles or product references—constitutes a solicitation, recommendation, endorsement, advertisement, or offer to buy or sell any securities, franchises, or other financial instruments, particularly in jurisdictions where such activity would be unlawful.
All content is of a general nature and may not address the specific circumstances of any individual or entity. It is not a substitute for professional advice or services. Any actions you take based on the information provided here are strictly at your own risk. You accept full responsibility for any decisions or outcomes arising from your use of this website and agree to release us from any liability in connection with your use of, or reliance upon, the content or products found herein.