
|
Hangzhou Hikvision Digital Technology Co., Ltd. (002415.sz) Avaliação DCF |
Totalmente Editável: Adapte-Se Às Suas Necessidades No Excel Ou Planilhas
Design Profissional: Modelos Confiáveis E Padrão Da Indústria
Pré-Construídos Para Uso Rápido E Eficiente
Compatível com MAC/PC, totalmente desbloqueado
Não É Necessária Experiência; Fácil De Seguir
Hangzhou Hikvision Digital Technology Co., Ltd. (002415.SZ) Bundle
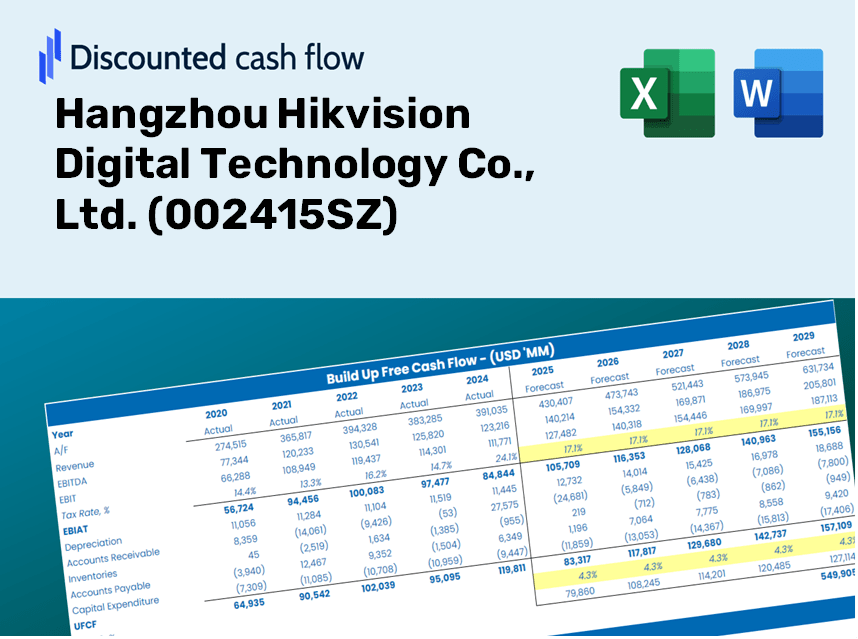
Explore o futuro financeiro da Hangzhou Hikvision Digital Technology Co., Ltd. (002415SZ) com a nossa calculadora DCF amigável! Digite suas suposições de crescimento, margens e despesas para determinar o valor intrínseco da Hangzhou Hikvision Digital Technology Co., Ltd. (002415SZ) e informe sua estratégia de investimento.
Discounted Cash Flow (DCF) - (USD MM)
| Year | AY1 2020 |
AY2 2021 |
AY3 2022 |
AY4 2023 |
AY5 2024 |
FY1 2025 |
FY2 2026 |
FY3 2027 |
FY4 2028 |
FY5 2029 |
|---|---|---|---|---|---|---|---|---|---|---|
| Revenue | 63,503.5 | 81,420.1 | 83,166.3 | 89,341.2 | 92,495.5 | 102,048.9 | 112,588.9 | 124,217.6 | 137,047.3 | 151,202.2 |
| Revenue Growth, % | 0 | 28.21 | 2.14 | 7.42 | 3.53 | 10.33 | 10.33 | 10.33 | 10.33 | 10.33 |
| EBITDA | 15,655.2 | 18,425.6 | 14,124.3 | 16,153.2 | 14,999.0 | 20,116.3 | 22,194.0 | 24,486.3 | 27,015.4 | 29,805.6 |
| EBITDA, % | 24.65 | 22.63 | 16.98 | 18.08 | 16.22 | 19.71 | 19.71 | 19.71 | 19.71 | 19.71 |
| Depreciation | 800.6 | 825.7 | 1,007.8 | 1,401.8 | 1,570.5 | 1,378.4 | 1,520.8 | 1,677.9 | 1,851.2 | 2,042.4 |
| Depreciation, % | 1.26 | 1.01 | 1.21 | 1.57 | 1.7 | 1.35 | 1.35 | 1.35 | 1.35 | 1.35 |
| EBIT | 14,854.5 | 17,599.9 | 13,116.5 | 14,751.4 | 13,428.5 | 18,737.9 | 20,673.2 | 22,808.5 | 25,164.2 | 27,763.3 |
| EBIT, % | 23.39 | 21.62 | 15.77 | 16.51 | 14.52 | 18.36 | 18.36 | 18.36 | 18.36 | 18.36 |
| Total Cash | 35,482.4 | 34,756.2 | 40,024.7 | 49,629.5 | 36,271.5 | 49,280.0 | 54,369.9 | 59,985.5 | 66,181.0 | 73,016.5 |
| Total Cash, percent | .0 | .0 | .0 | .0 | .0 | .0 | .0 | .0 | .0 | .0 |
| Account Receivables | 25,488.0 | 30,424.9 | 36,028.7 | 41,188.8 | 44,441.5 | 43,876.0 | 48,407.7 | 53,407.5 | 58,923.7 | 65,009.5 |
| Account Receivables, % | 40.14 | 37.37 | 43.32 | 46.1 | 48.05 | 43 | 43 | 43 | 43 | 43 |
| Inventories | 11,477.9 | 17,974.1 | 18,998.2 | 19,211.4 | 19,110.7 | 21,462.6 | 23,679.4 | 26,125.1 | 28,823.4 | 31,800.4 |
| Inventories, % | 18.07 | 22.08 | 22.84 | 21.5 | 20.66 | 21.03 | 21.03 | 21.03 | 21.03 | 21.03 |
| Accounts Payable | 14,630.8 | 15,889.7 | 16,025.6 | 19,163.5 | 21,382.4 | 21,714.2 | 23,957.0 | 26,431.4 | 29,161.3 | 32,173.2 |
| Accounts Payable, % | 23.04 | 19.52 | 19.27 | 21.45 | 23.12 | 21.28 | 21.28 | 21.28 | 21.28 | 21.28 |
| Capital Expenditure | -2,003.6 | -3,098.3 | -3,755.7 | -4,047.8 | -4,665.7 | -4,296.5 | -4,740.3 | -5,229.9 | -5,770.1 | -6,366.0 |
| Capital Expenditure, % | -3.16 | -3.81 | -4.52 | -4.53 | -5.04 | -4.21 | -4.21 | -4.21 | -4.21 | -4.21 |
| Tax Rate, % | 16.5 | 16.5 | 16.5 | 16.5 | 16.5 | 16.5 | 16.5 | 16.5 | 16.5 | 16.5 |
| EBITAT | 13,018.8 | 16,010.5 | 11,335.3 | 12,926.6 | 11,213.3 | 16,345.6 | 18,033.9 | 19,896.5 | 21,951.5 | 24,218.8 |
| Depreciation | ||||||||||
| Changes in Account Receivables | ||||||||||
| Changes in Inventories | ||||||||||
| Changes in Accounts Payable | ||||||||||
| Capital Expenditure | ||||||||||
| UFCF | -10,519.3 | 3,563.6 | 2,095.4 | 8,045.3 | 7,185.0 | 11,972.9 | 10,308.7 | 11,373.4 | 12,548.1 | 13,844.1 |
| WACC, % | 5.87 | 5.88 | 5.87 | 5.87 | 5.87 | 5.87 | 5.87 | 5.87 | 5.87 | 5.87 |
| PV UFCF | ||||||||||
| SUM PV UFCF | 50,484.0 | |||||||||
| Long Term Growth Rate, % | 3.00 | |||||||||
| Free cash flow (T + 1) | 14,259 | |||||||||
| Terminal Value | 496,387 | |||||||||
| Present Terminal Value | 373,166 | |||||||||
| Enterprise Value | 423,650 | |||||||||
| Net Debt | -29,745 | |||||||||
| Equity Value | 453,395 | |||||||||
| Diluted Shares Outstanding, MM | 9,235 | |||||||||
| Equity Value Per Share | 49.10 |
What You'll Receive
- Flexible Forecast Inputs: Effortlessly adjust key metrics (growth %, margins, WACC) for a variety of scenarios.
- Real-World Data: Pre-loaded financial information for Hangzhou Hikvision Digital Technology Co., Ltd. ([002415SZ]) to kickstart your analysis.
- Automated DCF Outputs: The template computes Net Present Value (NPV) and intrinsic value automatically.
- Customizable and Professional: A refined Excel model tailored to your valuation requirements.
- Designed for Analysts and Investors: Perfect for evaluating forecasts, confirming strategies, and optimizing your time.
Key Features
- 🔍 Real-Life Hikvision Financials: Pre-filled historical and projected data for Hangzhou Hikvision Digital Technology Co., Ltd. (002415SZ).
- ✏️ Fully Customizable Inputs: Adjust all key parameters (yellow cells) such as WACC, growth %, and tax rates.
- 📊 Professional DCF Valuation: Integrated formulas calculate Hikvision’s intrinsic value using the Discounted Cash Flow method.
- ⚡ Instant Results: Visualize Hikvision’s valuation immediately after any adjustments.
- Scenario Analysis: Evaluate and compare outcomes for different financial assumptions side-by-side.
How It Works
- Step 1: Download the prebuilt Excel template featuring Hangzhou Hikvision Digital Technology Co., Ltd.'s ([002415SZ]) data.
- Step 2: Review the pre-populated sheets to familiarize yourself with the essential metrics.
- Step 3: Modify forecasts and assumptions in the editable yellow cells (WACC, growth, margins).
- Step 4: Instantly see updated results, including the intrinsic value of Hangzhou Hikvision ([002415SZ]).
- Step 5: Make informed investment decisions or create reports based on the generated outputs.
Why Opt for This Calculator?
- Precise Data: Leverage real Hangzhou Hikvision Digital Technology Co., Ltd. financials for dependable valuation outcomes.
- Customizable: Tailor essential parameters such as growth rates, WACC, and tax rates to align with your forecasts.
- Efficient: Built-in calculations save you the hassle of starting from the ground up.
- Professional-Grade Solution: Crafted for investors, analysts, and consultants working with Hikvision ([002415SZ]).
- Intuitive Design: User-friendly layout and clear instructions make it accessible for everyone.
Who Should Use This Product?
- Professional Investors: Develop comprehensive and accurate valuation models for portfolio assessments of Hikvision (002415SZ).
- Corporate Finance Teams: Evaluate valuation scenarios to inform strategic decisions within your organization.
- Consultants and Advisors: Deliver precise valuation insights for clients interested in Hikvision (002415SZ) stock.
- Students and Educators: Utilize real-world data to enhance learning and practice in financial modeling.
- Tech Enthusiasts: Gain insights into the valuation methods of technology companies like Hikvision (002415SZ).
Contents of the Template
- Operating and Balance Sheet Data: Pre-filled historical data and forecasts for Hangzhou Hikvision Digital Technology Co., Ltd. (002415SZ), including revenue, EBITDA, EBIT, and capital expenditures.
- WACC Calculation: A dedicated sheet for the Weighted Average Cost of Capital (WACC), incorporating parameters such as Beta, risk-free rate, and share price.
- DCF Valuation (Unlevered and Levered): Customizable Discounted Cash Flow models that demonstrate intrinsic value along with detailed computations.
- Financial Statements: Pre-loaded annual and quarterly financial statements to facilitate in-depth analysis.
- Key Ratios: A collection of profitability, leverage, and efficiency ratios relevant to Hangzhou Hikvision Digital Technology Co., Ltd. (002415SZ).
- Dashboard and Charts: Visual overview of valuation outputs and assumptions, making it easier to analyze the results.
Disclaimer
All information, articles, and product details provided on this website are for general informational and educational purposes only. We do not claim any ownership over, nor do we intend to infringe upon, any trademarks, copyrights, logos, brand names, or other intellectual property mentioned or depicted on this site. Such intellectual property remains the property of its respective owners, and any references here are made solely for identification or informational purposes, without implying any affiliation, endorsement, or partnership.
We make no representations or warranties, express or implied, regarding the accuracy, completeness, or suitability of any content or products presented. Nothing on this website should be construed as legal, tax, investment, financial, medical, or other professional advice. In addition, no part of this site—including articles or product references—constitutes a solicitation, recommendation, endorsement, advertisement, or offer to buy or sell any securities, franchises, or other financial instruments, particularly in jurisdictions where such activity would be unlawful.
All content is of a general nature and may not address the specific circumstances of any individual or entity. It is not a substitute for professional advice or services. Any actions you take based on the information provided here are strictly at your own risk. You accept full responsibility for any decisions or outcomes arising from your use of this website and agree to release us from any liability in connection with your use of, or reliance upon, the content or products found herein.