
|
Rainbow Digital Commercial Co., Ltd. (002419.SZ) Avaliação DCF |
Totalmente Editável: Adapte-Se Às Suas Necessidades No Excel Ou Planilhas
Design Profissional: Modelos Confiáveis E Padrão Da Indústria
Pré-Construídos Para Uso Rápido E Eficiente
Compatível com MAC/PC, totalmente desbloqueado
Não É Necessária Experiência; Fácil De Seguir
Rainbow Digital Commercial Co., Ltd. (002419.SZ) Bundle
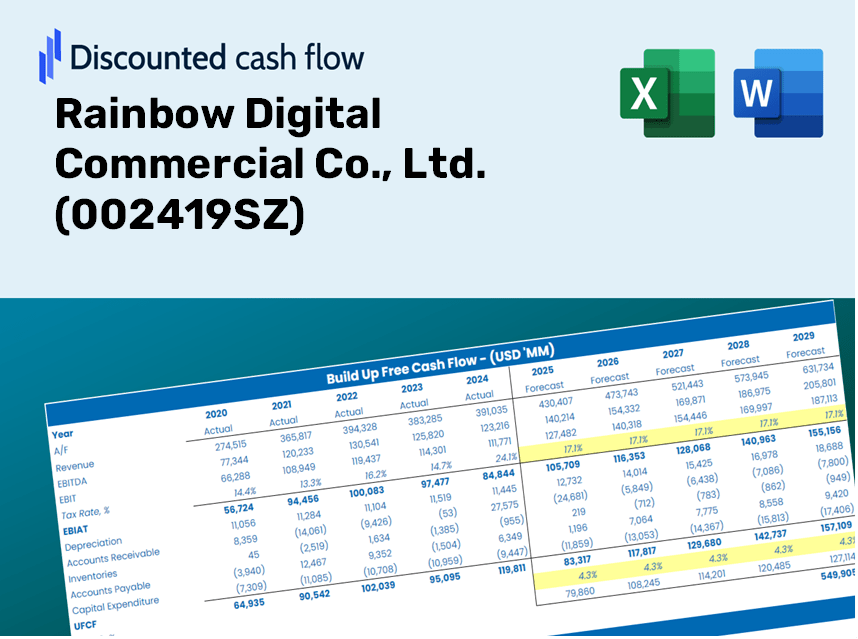
Procurando avaliar o valor intrínseco da Rainbow Digital Commercial Co., Ltd.? Nossa calculadora DCF (002419SZ) integra dados do mundo real com opções abrangentes de personalização, permitindo refinar as previsões e fazer escolhas de investimento mais informadas.
Discounted Cash Flow (DCF) - (USD MM)
| Year | AY1 2020 |
AY2 2021 |
AY3 2022 |
AY4 2023 |
AY5 2024 |
FY1 2025 |
FY2 2026 |
FY3 2027 |
FY4 2028 |
FY5 2029 |
|---|---|---|---|---|---|---|---|---|---|---|
| Revenue | 11,799.9 | 12,268.2 | 12,125.0 | 12,086.5 | 11,786.1 | 11,786.0 | 11,785.9 | 11,785.9 | 11,785.8 | 11,785.8 |
| Revenue Growth, % | 0 | 3.97 | -1.17 | -0.31803 | -2.49 | -0.000511996504 | -0.000511996504 | -0.000511996504 | -0.000511996504 | -0.000511996504 |
| EBITDA | 533.9 | 2,633.8 | 2,520.0 | 2,138.1 | 1,864.8 | 1,892.6 | 1,892.6 | 1,892.5 | 1,892.5 | 1,892.5 |
| EBITDA, % | 4.52 | 21.47 | 20.78 | 17.69 | 15.82 | 16.06 | 16.06 | 16.06 | 16.06 | 16.06 |
| Depreciation | 559.9 | 1,904.4 | 1,967.8 | 1,581.8 | 1,551.6 | 1,479.1 | 1,479.1 | 1,479.1 | 1,479.1 | 1,479.1 |
| Depreciation, % | 4.75 | 15.52 | 16.23 | 13.09 | 13.17 | 12.55 | 12.55 | 12.55 | 12.55 | 12.55 |
| EBIT | -26.0 | 729.5 | 552.2 | 556.3 | 313.1 | 413.4 | 413.4 | 413.4 | 413.4 | 413.4 |
| EBIT, % | -0.22026 | 5.95 | 4.55 | 4.6 | 2.66 | 3.51 | 3.51 | 3.51 | 3.51 | 3.51 |
| Total Cash | 7,798.7 | 7,801.0 | 8,114.1 | 8,023.4 | 3,086.9 | 6,816.4 | 6,816.3 | 6,816.3 | 6,816.3 | 6,816.2 |
| Total Cash, percent | .0 | .0 | .0 | .0 | .0 | .0 | .0 | .0 | .0 | .0 |
| Account Receivables | 548.7 | 108.4 | 247.5 | 233.6 | 237.4 | 271.6 | 271.6 | 271.6 | 271.6 | 271.6 |
| Account Receivables, % | 4.65 | 0.88332 | 2.04 | 1.93 | 2.01 | 2.3 | 2.3 | 2.3 | 2.3 | 2.3 |
| Inventories | 773.0 | 845.3 | 971.0 | 797.7 | 855.6 | 832.3 | 832.3 | 832.3 | 832.3 | 832.3 |
| Inventories, % | 6.55 | 6.89 | 8.01 | 6.6 | 7.26 | 7.06 | 7.06 | 7.06 | 7.06 | 7.06 |
| Accounts Payable | 2,826.4 | 2,584.8 | 2,357.2 | 2,505.8 | 2,205.7 | 2,449.3 | 2,449.3 | 2,449.3 | 2,449.3 | 2,449.3 |
| Accounts Payable, % | 23.95 | 21.07 | 19.44 | 20.73 | 18.71 | 20.78 | 20.78 | 20.78 | 20.78 | 20.78 |
| Capital Expenditure | -834.8 | -745.9 | -523.7 | -476.0 | -578.3 | -620.4 | -620.4 | -620.4 | -620.4 | -620.4 |
| Capital Expenditure, % | -7.07 | -6.08 | -4.32 | -3.94 | -4.91 | -5.26 | -5.26 | -5.26 | -5.26 | -5.26 |
| Tax Rate, % | 24.07 | 24.07 | 24.07 | 24.07 | 24.07 | 24.07 | 24.07 | 24.07 | 24.07 | 24.07 |
| EBITAT | -17.7 | 509.8 | 328.6 | 413.7 | 237.8 | 287.7 | 287.7 | 287.7 | 287.7 | 287.7 |
| Depreciation | ||||||||||
| Changes in Account Receivables | ||||||||||
| Changes in Inventories | ||||||||||
| Changes in Accounts Payable | ||||||||||
| Capital Expenditure | ||||||||||
| UFCF | 1,212.1 | 1,794.7 | 1,280.2 | 1,855.1 | 849.4 | 1,379.2 | 1,146.4 | 1,146.4 | 1,146.4 | 1,146.4 |
| WACC, % | 3.19 | 3.23 | 2.99 | 3.33 | 3.37 | 3.22 | 3.22 | 3.22 | 3.22 | 3.22 |
| PV UFCF | ||||||||||
| SUM PV UFCF | 5,442.3 | |||||||||
| Long Term Growth Rate, % | 3.40 | |||||||||
| Free cash flow (T + 1) | 1,185 | |||||||||
| Terminal Value | -674,825 | |||||||||
| Present Terminal Value | -575,811 | |||||||||
| Enterprise Value | -570,369 | |||||||||
| Net Debt | 9,110 | |||||||||
| Equity Value | -579,479 | |||||||||
| Diluted Shares Outstanding, MM | 1,169 | |||||||||
| Equity Value Per Share | -495.50 |
What You Will Receive
- Authentic Rainbow Digital Financials: Access to both historical and projected data for precise valuation.
- Customizable Inputs: Easy modifications for WACC, tax rates, revenue growth, and capital expenditures.
- Real-Time Calculations: Intrinsic value and NPV are computed automatically.
- Scenario Analysis: Evaluate various scenarios to project the future performance of Rainbow Digital (002419SZ).
- User-Friendly Interface: Designed for industry professionals while remaining accessible to newcomers.
Key Features
- Pre-Loaded Data: Historical financial statements and forecasts for Rainbow Digital Commercial Co., Ltd. (002419SZ).
- Fully Adjustable Inputs: Customize WACC, tax rates, revenue growth, and EBITDA margins.
- Instant Results: View the intrinsic value of Rainbow Digital Commercial Co., Ltd. (002419SZ) recalculating in real time.
- Clear Visual Outputs: Dashboard charts illustrate valuation results and essential metrics.
- Built for Accuracy: A comprehensive tool designed for analysts, investors, and finance professionals.
How It Works
- Step 1: Download the Excel spreadsheet.
- Step 2: Examine the pre-filled financial data and forecasts for Rainbow Digital Commercial Co., Ltd. (002419SZ).
- Step 3: Adjust key inputs such as revenue growth, WACC, and tax rates (highlighted cells).
- Step 4: Observe how the DCF model updates in real-time as you modify your assumptions.
- Step 5: Evaluate the outputs and leverage the results for informed investment choices.
Why Choose the Rainbow Digital Calculator?
- User-Friendly Interface: Tailored for both novices and seasoned pros.
- Customizable Inputs: Easily adjust parameters to suit your analysis needs.
- Real-Time Valuation: Observe immediate updates to Rainbow Digital’s valuation with every input change.
- Pre-Loaded Data: Comes equipped with Rainbow Digital's actual financial metrics for swift evaluations.
- Endorsed by Experts: Trusted by investors and analysts for making well-informed choices.
Who Can Benefit from This Product?
- Finance Students: Acquire essential valuation skills and practice with real market data for Rainbow Digital Commercial Co., Ltd. (002419SZ).
- Researchers: Utilize industry-standard models to enhance your academic projects related to Rainbow Digital Commercial Co., Ltd. (002419SZ).
- Investors: Validate your investment hypotheses and evaluate valuation metrics for Rainbow Digital Commercial Co., Ltd. (002419SZ).
- Market Analysts: Optimize your analyses with an adaptable DCF model specifically designed for Rainbow Digital Commercial Co., Ltd. (002419SZ).
- Entrepreneurs: Understand the analytical methods applied to larger public firms, like Rainbow Digital Commercial Co., Ltd. (002419SZ).
Overview of the Template Features
- Pre-Filled DCF Model: Rainbow Digital Commercial Co., Ltd.'s (002419SZ) financial data preloaded for immediate access.
- WACC Calculator: Comprehensive calculations for the Weighted Average Cost of Capital.
- Financial Ratios: Assess Rainbow Digital's profitability, leverage, and operational efficiency.
- Editable Inputs: Modify assumptions such as growth rates, profit margins, and capital expenditures to suit your analysis.
- Financial Statements: Access annual and quarterly reports for in-depth evaluation.
- Interactive Dashboard: Effortlessly visualize essential valuation metrics and outcomes.
Disclaimer
All information, articles, and product details provided on this website are for general informational and educational purposes only. We do not claim any ownership over, nor do we intend to infringe upon, any trademarks, copyrights, logos, brand names, or other intellectual property mentioned or depicted on this site. Such intellectual property remains the property of its respective owners, and any references here are made solely for identification or informational purposes, without implying any affiliation, endorsement, or partnership.
We make no representations or warranties, express or implied, regarding the accuracy, completeness, or suitability of any content or products presented. Nothing on this website should be construed as legal, tax, investment, financial, medical, or other professional advice. In addition, no part of this site—including articles or product references—constitutes a solicitation, recommendation, endorsement, advertisement, or offer to buy or sell any securities, franchises, or other financial instruments, particularly in jurisdictions where such activity would be unlawful.
All content is of a general nature and may not address the specific circumstances of any individual or entity. It is not a substitute for professional advice or services. Any actions you take based on the information provided here are strictly at your own risk. You accept full responsibility for any decisions or outcomes arising from your use of this website and agree to release us from any liability in connection with your use of, or reliance upon, the content or products found herein.