
|
Sichuan Kelun Pharmaceutical Co., Ltd. (002422.sz) Avaliação DCF |
Totalmente Editável: Adapte-Se Às Suas Necessidades No Excel Ou Planilhas
Design Profissional: Modelos Confiáveis E Padrão Da Indústria
Pré-Construídos Para Uso Rápido E Eficiente
Compatível com MAC/PC, totalmente desbloqueado
Não É Necessária Experiência; Fácil De Seguir
Sichuan Kelun Pharmaceutical Co., Ltd. (002422.SZ) Bundle
Ganhe domínio sobre sua análise de avaliação Sichuan Kelun Pharmaceutical Co., Ltd. (002422SZ) usando nossa sofisticada calculadora DCF! Este modelo do Excel é pré -carregado com dados autênticos (002422SZ), permitindo que você ajuste as previsões e suposições para determinar com precisão o valor intrínseco de Sichuan Kelun Pharmaceutical Co., Ltd. (002422SZ).
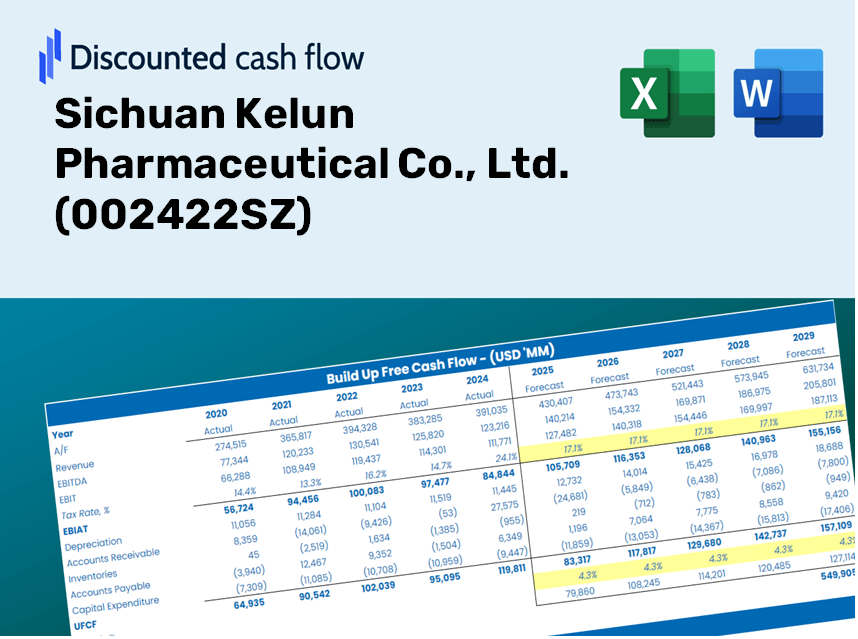
Discounted Cash Flow (DCF) - (USD MM)
| Year | AY1 2020 |
AY2 2021 |
AY3 2022 |
AY4 2023 |
AY5 2024 |
FY1 2025 |
FY2 2026 |
FY3 2027 |
FY4 2028 |
FY5 2029 |
|---|---|---|---|---|---|---|---|---|---|---|
| Revenue | 16,464.2 | 17,277.4 | 19,038.2 | 21,453.9 | 21,812.4 | 23,420.6 | 25,147.3 | 27,001.3 | 28,991.9 | 31,129.4 |
| Revenue Growth, % | 0 | 4.94 | 10.19 | 12.69 | 1.67 | 7.37 | 7.37 | 7.37 | 7.37 | 7.37 |
| EBITDA | 2,375.4 | 2,689.9 | 3,415.9 | 4,595.5 | 5,248.3 | 4,375.9 | 4,698.5 | 5,044.9 | 5,416.9 | 5,816.2 |
| EBITDA, % | 14.43 | 15.57 | 17.94 | 21.42 | 24.06 | 18.68 | 18.68 | 18.68 | 18.68 | 18.68 |
| Depreciation | 1,154.8 | 1,205.9 | 1,156.2 | 1,188.7 | 1,204.4 | 1,458.1 | 1,565.6 | 1,681.0 | 1,805.0 | 1,938.0 |
| Depreciation, % | 7.01 | 6.98 | 6.07 | 5.54 | 5.52 | 6.23 | 6.23 | 6.23 | 6.23 | 6.23 |
| EBIT | 1,220.6 | 1,484.0 | 2,259.8 | 3,406.8 | 4,044.0 | 2,917.8 | 3,132.9 | 3,363.9 | 3,611.9 | 3,878.2 |
| EBIT, % | 7.41 | 8.59 | 11.87 | 15.88 | 18.54 | 12.46 | 12.46 | 12.46 | 12.46 | 12.46 |
| Total Cash | 3,037.4 | 3,279.1 | 5,173.4 | 6,946.0 | 5,895.1 | 5,808.5 | 6,236.7 | 6,696.5 | 7,190.2 | 7,720.3 |
| Total Cash, percent | .0 | .0 | .0 | .0 | .0 | .0 | .0 | .0 | .0 | .0 |
| Account Receivables | 7,761.6 | 6,922.4 | 7,765.0 | 6,120.2 | 6,224.3 | 8,668.3 | 9,307.4 | 9,993.6 | 10,730.3 | 11,521.4 |
| Account Receivables, % | 47.14 | 40.07 | 40.79 | 28.53 | 28.54 | 37.01 | 37.01 | 37.01 | 37.01 | 37.01 |
| Inventories | 3,468.1 | 3,363.0 | 3,190.7 | 3,839.8 | 3,800.6 | 4,338.0 | 4,657.8 | 5,001.2 | 5,369.9 | 5,765.9 |
| Inventories, % | 21.06 | 19.46 | 16.76 | 17.9 | 17.42 | 18.52 | 18.52 | 18.52 | 18.52 | 18.52 |
| Accounts Payable | 1,860.9 | 2,155.9 | 2,114.7 | 2,164.1 | 2,574.4 | 2,659.5 | 2,855.6 | 3,066.1 | 3,292.2 | 3,534.9 |
| Accounts Payable, % | 11.3 | 12.48 | 11.11 | 10.09 | 11.8 | 11.36 | 11.36 | 11.36 | 11.36 | 11.36 |
| Capital Expenditure | -1,230.9 | -990.6 | -896.0 | -1,769.2 | -1,678.3 | -1,585.9 | -1,702.8 | -1,828.3 | -1,963.1 | -2,107.9 |
| Capital Expenditure, % | -7.48 | -5.73 | -4.71 | -8.25 | -7.69 | -6.77 | -6.77 | -6.77 | -6.77 | -6.77 |
| Tax Rate, % | 31.49 | 31.49 | 31.49 | 31.49 | 31.49 | 31.49 | 31.49 | 31.49 | 31.49 | 31.49 |
| EBITAT | 1,060.0 | 1,389.4 | 1,863.5 | 2,337.0 | 2,770.5 | 2,334.5 | 2,506.6 | 2,691.4 | 2,889.8 | 3,102.9 |
| Depreciation | ||||||||||
| Changes in Account Receivables | ||||||||||
| Changes in Inventories | ||||||||||
| Changes in Accounts Payable | ||||||||||
| Capital Expenditure | ||||||||||
| UFCF | -8,384.9 | 2,843.9 | 1,412.3 | 2,801.7 | 2,641.9 | -689.5 | 1,606.6 | 1,725.1 | 1,852.2 | 1,988.8 |
| WACC, % | 4.5 | 4.52 | 4.49 | 4.46 | 4.46 | 4.49 | 4.49 | 4.49 | 4.49 | 4.49 |
| PV UFCF | ||||||||||
| SUM PV UFCF | 5,474.9 | |||||||||
| Long Term Growth Rate, % | 3.00 | |||||||||
| Free cash flow (T + 1) | 2,048 | |||||||||
| Terminal Value | 137,770 | |||||||||
| Present Terminal Value | 110,624 | |||||||||
| Enterprise Value | 116,098 | |||||||||
| Net Debt | -637 | |||||||||
| Equity Value | 116,736 | |||||||||
| Diluted Shares Outstanding, MM | 1,578 | |||||||||
| Equity Value Per Share | 73.96 |
What You Will Receive
- Flexible Forecast Inputs: Effortlessly adjust key assumptions (growth %, profit margins, WACC) to explore various scenarios.
- Comprehensive Market Data: Pre-loaded financial data for Sichuan Kelun Pharmaceutical Co., Ltd. (002422SZ) to facilitate your analysis.
- Instant DCF Calculations: The template automatically computes Net Present Value (NPV) and intrinsic value.
- Tailored and Professional Design: An advanced Excel model that aligns with your valuation requirements.
- Designed for Analysts and Investors: Perfect for evaluating projections, confirming strategies, and maximizing efficiency.
Key Features
- Comprehensive Historical Data: Access Sichuan Kelun Pharmaceutical’s past financial reports and pre-populated projections.
- Customizable Parameters: Adjust WACC, tax rates, revenue growth, and EBITDA margins to fit your analysis.
- Real-Time Valuation: Instantly view the recalculated intrinsic value of Sichuan Kelun Pharmaceutical (002422SZ).
- Intuitive Visual Representations: Dashboard graphs showcase valuation data and essential metrics clearly.
- Designed for Precision: A reliable tool tailored for analysts, investors, and financial professionals.
How It Functions
- Download: Obtain the pre-prepared Excel file containing Sichuan Kelun Pharmaceutical Co., Ltd.'s (002422SZ) financial data.
- Customize: Modify projections such as revenue growth, EBITDA %, and WACC to fit your analysis.
- Update Automatically: Watch as intrinsic value and NPV calculations refresh in real-time.
- Test Scenarios: Generate various forecasts and instantly compare the results.
- Make Decisions: Leverage the valuation data to inform your investment strategy.
Why Choose This Calculator for Sichuan Kelun Pharmaceutical Co., Ltd. (002422SZ)?
- Designed for Experts: A sophisticated tool tailored for analysts, CFOs, and consultants.
- Accurate Data: Historical and projected financials for Sichuan Kelun preloaded for reliability.
- Flexible Scenario Analysis: Effortlessly simulate various forecasts and assumptions.
- Comprehensive Outputs: Automatically computes intrinsic value, NPV, and essential metrics.
- User-Friendly: Step-by-step guidance simplifies the process for all users.
Who Can Benefit from This Product?
- Investors: Accurately assess the fair value of Sichuan Kelun Pharmaceutical Co., Ltd. (002422SZ) prior to making investment choices.
- CFOs: Utilize a high-quality DCF model for comprehensive financial reporting and analysis.
- Consultants: Easily customize the template for client valuation reports.
- Entrepreneurs: Discover financial modeling techniques employed by leading pharmaceutical firms.
- Educators: Implement it as a resource for teaching valuation methods and principles.
Contents of the Template
- Operating and Balance Sheet Data: Pre-filled historical data and forecasts for Sichuan Kelun Pharmaceutical Co., Ltd. (002422SZ), including revenue, EBITDA, EBIT, and capital expenditures.
- WACC Calculation: A dedicated sheet for Weighted Average Cost of Capital (WACC), featuring parameters such as Beta, risk-free rate, and share price.
- DCF Valuation (Unlevered and Levered): Customizable Discounted Cash Flow models that outline intrinsic value with thorough calculations.
- Financial Statements: Pre-loaded annual and quarterly financial statements to facilitate analysis.
- Key Ratios: A collection of profitability, leverage, and efficiency ratios specific to Sichuan Kelun Pharmaceutical Co., Ltd. (002422SZ).
- Dashboard and Charts: A visual summary of valuation results and assumptions for easy analysis of outcomes.
Disclaimer
All information, articles, and product details provided on this website are for general informational and educational purposes only. We do not claim any ownership over, nor do we intend to infringe upon, any trademarks, copyrights, logos, brand names, or other intellectual property mentioned or depicted on this site. Such intellectual property remains the property of its respective owners, and any references here are made solely for identification or informational purposes, without implying any affiliation, endorsement, or partnership.
We make no representations or warranties, express or implied, regarding the accuracy, completeness, or suitability of any content or products presented. Nothing on this website should be construed as legal, tax, investment, financial, medical, or other professional advice. In addition, no part of this site—including articles or product references—constitutes a solicitation, recommendation, endorsement, advertisement, or offer to buy or sell any securities, franchises, or other financial instruments, particularly in jurisdictions where such activity would be unlawful.
All content is of a general nature and may not address the specific circumstances of any individual or entity. It is not a substitute for professional advice or services. Any actions you take based on the information provided here are strictly at your own risk. You accept full responsibility for any decisions or outcomes arising from your use of this website and agree to release us from any liability in connection with your use of, or reliance upon, the content or products found herein.