
|
Shenzhen MTC Co., Ltd. (002429.sz) Avaliação DCF |
Totalmente Editável: Adapte-Se Às Suas Necessidades No Excel Ou Planilhas
Design Profissional: Modelos Confiáveis E Padrão Da Indústria
Pré-Construídos Para Uso Rápido E Eficiente
Compatível com MAC/PC, totalmente desbloqueado
Não É Necessária Experiência; Fácil De Seguir
Shenzhen MTC Co., Ltd. (002429.SZ) Bundle
Ganhe domínio sobre a análise de avaliação Shenzhen Mtc Co., Ltd. (002429SZ) com nossa calculadora DCF de ponta! Carregado com dados reais (002429SZ), esse modelo do Excel permite ajustar as previsões e suposições para determinar o valor intrínseco da Shenzhen Mtc Co., Ltd. com precisão.
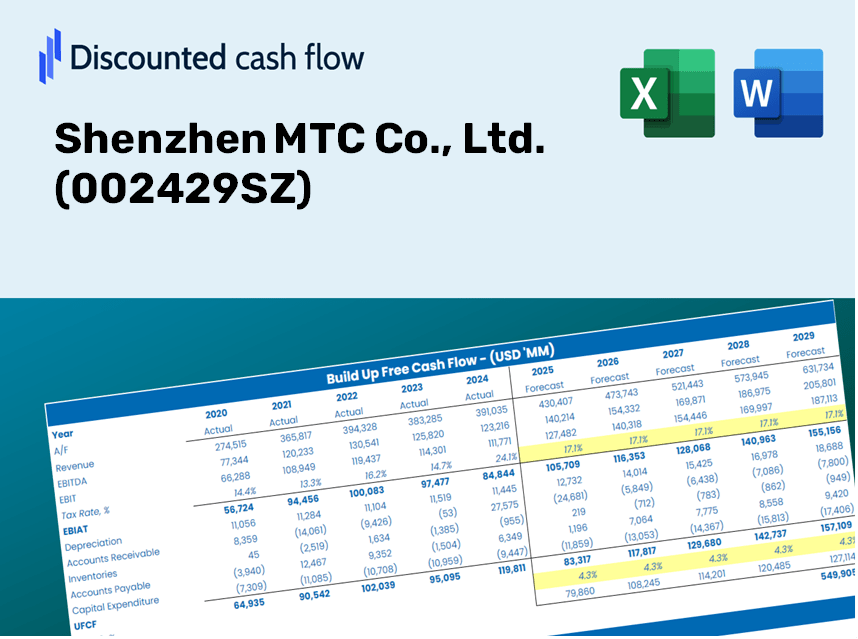
Discounted Cash Flow (DCF) - (USD MM)
| Year | AY1 2020 |
AY2 2021 |
AY3 2022 |
AY4 2023 |
AY5 2024 |
FY1 2025 |
FY2 2026 |
FY3 2027 |
FY4 2028 |
FY5 2029 |
|---|---|---|---|---|---|---|---|---|---|---|
| Revenue | 20,186.2 | 22,538.1 | 15,028.4 | 17,167.0 | 20,326.3 | 20,883.5 | 21,455.9 | 22,044.1 | 22,648.3 | 23,269.2 |
| Revenue Growth, % | 0 | 11.65 | -33.32 | 14.23 | 18.4 | 2.74 | 2.74 | 2.74 | 2.74 | 2.74 |
| EBITDA | 2,309.9 | 1,055.8 | 1,820.0 | 2,430.1 | 2,856.1 | 2,357.5 | 2,422.1 | 2,488.5 | 2,556.8 | 2,626.8 |
| EBITDA, % | 11.44 | 4.68 | 12.11 | 14.16 | 14.05 | 11.29 | 11.29 | 11.29 | 11.29 | 11.29 |
| Depreciation | 316.7 | 536.9 | 632.8 | 692.9 | 840.0 | 682.1 | 700.8 | 720.0 | 739.7 | 760.0 |
| Depreciation, % | 1.57 | 2.38 | 4.21 | 4.04 | 4.13 | 3.27 | 3.27 | 3.27 | 3.27 | 3.27 |
| EBIT | 1,993.2 | 518.9 | 1,187.2 | 1,737.2 | 2,016.0 | 1,675.4 | 1,721.3 | 1,768.5 | 1,817.0 | 1,866.8 |
| EBIT, % | 9.87 | 2.3 | 7.9 | 10.12 | 9.92 | 8.02 | 8.02 | 8.02 | 8.02 | 8.02 |
| Total Cash | 3,827.2 | 3,212.5 | 5,128.2 | 4,295.7 | 4,822.1 | 4,848.4 | 4,981.3 | 5,117.9 | 5,258.2 | 5,402.3 |
| Total Cash, percent | .0 | .0 | .0 | .0 | .0 | .0 | .0 | .0 | .0 | .0 |
| Account Receivables | 8,517.2 | 9,656.6 | 6,588.9 | 5,278.8 | 9,395.1 | 8,597.8 | 8,833.5 | 9,075.7 | 9,324.4 | 9,580.0 |
| Account Receivables, % | 42.19 | 42.85 | 43.84 | 30.75 | 46.22 | 41.17 | 41.17 | 41.17 | 41.17 | 41.17 |
| Inventories | 2,375.9 | 2,503.6 | 2,232.7 | 2,678.4 | 3,407.5 | 2,927.9 | 3,008.1 | 3,090.6 | 3,175.3 | 3,262.4 |
| Inventories, % | 11.77 | 11.11 | 14.86 | 15.6 | 16.76 | 14.02 | 14.02 | 14.02 | 14.02 | 14.02 |
| Accounts Payable | 6,056.0 | 4,642.7 | 4,301.1 | 4,942.5 | 4,315.2 | 5,398.0 | 5,545.9 | 5,698.0 | 5,854.1 | 6,014.6 |
| Accounts Payable, % | 30 | 20.6 | 28.62 | 28.79 | 21.23 | 25.85 | 25.85 | 25.85 | 25.85 | 25.85 |
| Capital Expenditure | -2,085.4 | -2,038.2 | -1,948.6 | -781.9 | -782.1 | -1,701.7 | -1,748.4 | -1,796.3 | -1,845.5 | -1,896.1 |
| Capital Expenditure, % | -10.33 | -9.04 | -12.97 | -4.55 | -3.85 | -8.15 | -8.15 | -8.15 | -8.15 | -8.15 |
| Tax Rate, % | 19.6 | 19.6 | 19.6 | 19.6 | 19.6 | 19.6 | 19.6 | 19.6 | 19.6 | 19.6 |
| EBITAT | 1,854.7 | 315.9 | 1,139.5 | 1,613.8 | 1,620.9 | 1,418.1 | 1,457.0 | 1,496.9 | 1,538.0 | 1,580.1 |
| Depreciation | ||||||||||
| Changes in Account Receivables | ||||||||||
| Changes in Inventories | ||||||||||
| Changes in Accounts Payable | ||||||||||
| Capital Expenditure | ||||||||||
| UFCF | -4,751.2 | -3,865.7 | 2,820.6 | 3,030.8 | -3,794.0 | 2,758.1 | 241.4 | 248.1 | 254.9 | 261.8 |
| WACC, % | 6.06 | 5.87 | 6.08 | 6.06 | 5.98 | 6.01 | 6.01 | 6.01 | 6.01 | 6.01 |
| PV UFCF | ||||||||||
| SUM PV UFCF | 3,422.2 | |||||||||
| Long Term Growth Rate, % | 3.50 | |||||||||
| Free cash flow (T + 1) | 271 | |||||||||
| Terminal Value | 10,797 | |||||||||
| Present Terminal Value | 8,064 | |||||||||
| Enterprise Value | 11,486 | |||||||||
| Net Debt | -306 | |||||||||
| Equity Value | 11,792 | |||||||||
| Diluted Shares Outstanding, MM | 4,527 | |||||||||
| Equity Value Per Share | 2.60 |
What You Will Receive
- Authentic Shenzhen MTC Data: Comprehensive financials – including revenue and EBIT – derived from actual and projected statistics.
- Complete Customization: Modify key parameters (yellow cells) such as WACC, growth %, and tax rates to suit your analysis.
- Immediate Valuation Adjustments: Automatic recalculations allow you to assess the effect of changes on Shenzhen MTC’s fair value.
- Flexible Excel Template: Designed for quick modifications, scenario analyses, and in-depth forecasting.
- Efficient and Precise: Eliminate the need to construct models from the ground up while ensuring accuracy and adaptability.
Key Features
- Pre-Loaded Data: Historical financial statements and forecasts for Shenzhen MTC Co., Ltd. (002429SZ).
- Fully Adjustable Inputs: Modify WACC, tax rates, revenue growth, and EBITDA margins as needed.
- Instant Results: Watch the intrinsic value of Shenzhen MTC Co., Ltd. (002429SZ) update in real time.
- Clear Visual Outputs: Dashboard visuals showcase valuation results and essential metrics.
- Built for Accuracy: A professional-grade tool designed for analysts, investors, and finance professionals.
How It Functions
- Step 1: Download the prebuilt Excel template featuring Shenzhen MTC Co., Ltd.'s (002429SZ) data.
- Step 2: Review the populated sheets to familiarize yourself with the essential metrics.
- Step 3: Modify forecasts and assumptions in the editable yellow cells (WACC, growth, margins).
- Step 4: Instantly see the updated results, including Shenzhen MTC Co., Ltd.'s (002429SZ) intrinsic value.
- Step 5: Utilize the outputs to make informed investment choices or create comprehensive reports.
Why Opt for This Calculator?
- User-Friendly Interface: Tailored for both novices and seasoned professionals.
- Customizable Inputs: Effortlessly adjust parameters to suit your analysis needs.
- Real-Time Adjustments: Observe immediate changes to Shenzhen MTC Co., Ltd.’s valuation as you modify the inputs.
- Preconfigured Data: Comes preloaded with Shenzhen MTC Co., Ltd.’s actual financial figures for swift evaluations.
- Preferred by Experts: Employed by investors and analysts for making well-informed choices.
Who Can Benefit from This Product?
- Individual Investors: Gain insights to make well-informed decisions about investing in Shenzhen MTC Co., Ltd. (002429SZ).
- Financial Analysts: Enhance valuation processes with accessible financial models tailored for Shenzhen MTC Co., Ltd. (002429SZ).
- Consultants: Provide clients with quick and accurate valuation insights regarding Shenzhen MTC Co., Ltd. (002429SZ).
- Business Owners: Learn how major enterprises like Shenzhen MTC Co., Ltd. (002429SZ) are valued, aiding your strategic planning.
- Finance Students: Acquire practical valuation skills using real-world data and case studies focusing on Shenzhen MTC Co., Ltd. (002429SZ).
Contents of the Template
- Preloaded MTC Data: Historical and projected financial metrics, including revenue, EBIT, and capital investments.
- DCF and WACC Models: Professional-grade spreadsheets for determining intrinsic value and Weighted Average Cost of Capital.
- Editable Inputs: Yellow-highlighted cells for modifying revenue growth, tax rates, and discount rates.
- Financial Statements: Detailed annual and quarterly financials for in-depth analysis.
- Key Ratios: Profitability, leverage, and efficiency ratios for performance assessment.
- Dashboard and Charts: Visual representations of valuation results and assumptions.
Disclaimer
All information, articles, and product details provided on this website are for general informational and educational purposes only. We do not claim any ownership over, nor do we intend to infringe upon, any trademarks, copyrights, logos, brand names, or other intellectual property mentioned or depicted on this site. Such intellectual property remains the property of its respective owners, and any references here are made solely for identification or informational purposes, without implying any affiliation, endorsement, or partnership.
We make no representations or warranties, express or implied, regarding the accuracy, completeness, or suitability of any content or products presented. Nothing on this website should be construed as legal, tax, investment, financial, medical, or other professional advice. In addition, no part of this site—including articles or product references—constitutes a solicitation, recommendation, endorsement, advertisement, or offer to buy or sell any securities, franchises, or other financial instruments, particularly in jurisdictions where such activity would be unlawful.
All content is of a general nature and may not address the specific circumstances of any individual or entity. It is not a substitute for professional advice or services. Any actions you take based on the information provided here are strictly at your own risk. You accept full responsibility for any decisions or outcomes arising from your use of this website and agree to release us from any liability in connection with your use of, or reliance upon, the content or products found herein.