
|
Hangzhou Greatstar Industrial Co., Ltd (002444.sz) Avaliação DCF |
Totalmente Editável: Adapte-Se Às Suas Necessidades No Excel Ou Planilhas
Design Profissional: Modelos Confiáveis E Padrão Da Indústria
Pré-Construídos Para Uso Rápido E Eficiente
Compatível com MAC/PC, totalmente desbloqueado
Não É Necessária Experiência; Fácil De Seguir
Hangzhou Greatstar Industrial Co., Ltd (002444.SZ) Bundle
Explore o potencial financeiro da Hangzhou Greatstar Industrial Co., Ltd (002444SZ) com nossa calculadora DCF amigável! Digite suas suposições de crescimento, margens e custos para calcular o valor intrínseco da Hangzhou Greatstar Industrial Co., Ltd (002444SZ) e refine sua estratégia de investimento.
Discounted Cash Flow (DCF) - (USD MM)
| Year | AY1 2020 |
AY2 2021 |
AY3 2022 |
AY4 2023 |
AY5 2024 |
FY1 2025 |
FY2 2026 |
FY3 2027 |
FY4 2028 |
FY5 2029 |
|---|---|---|---|---|---|---|---|---|---|---|
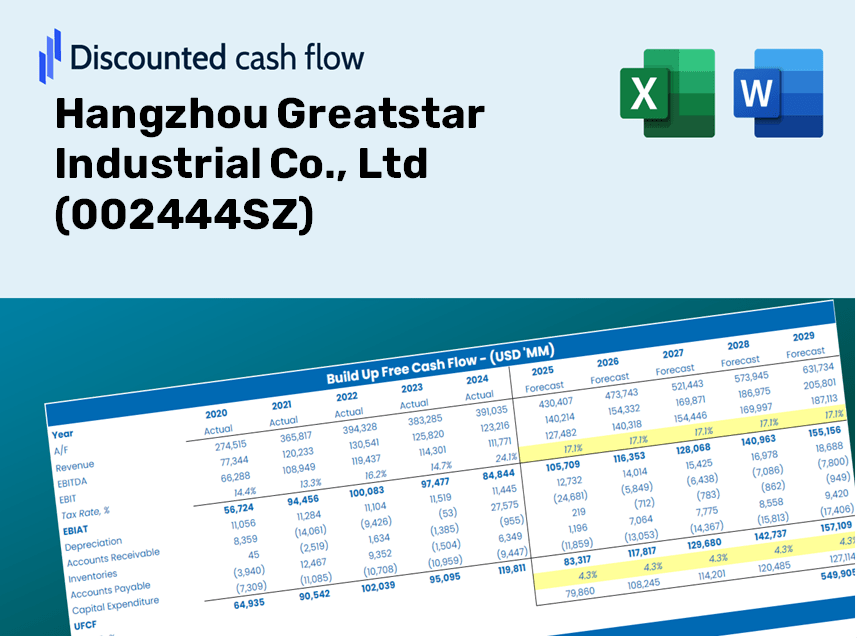
| Revenue | 8,544.4 | 10,919.7 | 12,610.2 | 10,930.0 | 14,795.5 | 17,211.6 | 20,022.3 | 23,292.0 | 27,095.7 | 31,520.6 |
| Revenue Growth, % | 0 | 27.8 | 15.48 | -13.32 | 35.37 | 16.33 | 16.33 | 16.33 | 16.33 | 16.33 |
| EBITDA | 1,781.2 | 1,713.8 | 1,983.1 | 2,326.0 | 3,106.0 | 3,254.4 | 3,785.9 | 4,404.1 | 5,123.3 | 5,960.0 |
| EBITDA, % | 20.85 | 15.69 | 15.73 | 21.28 | 20.99 | 18.91 | 18.91 | 18.91 | 18.91 | 18.91 |
| Depreciation | 147.0 | 195.5 | 213.7 | 252.5 | 261.6 | 319.6 | 371.8 | 432.5 | 503.1 | 585.3 |
| Depreciation, % | 1.72 | 1.79 | 1.69 | 2.31 | 1.77 | 1.86 | 1.86 | 1.86 | 1.86 | 1.86 |
| EBIT | 1,634.2 | 1,518.3 | 1,769.4 | 2,073.5 | 2,844.4 | 2,934.8 | 3,414.1 | 3,971.6 | 4,620.2 | 5,374.7 |
| EBIT, % | 19.13 | 13.9 | 14.03 | 18.97 | 19.23 | 17.05 | 17.05 | 17.05 | 17.05 | 17.05 |
| Total Cash | 3,814.3 | 4,047.3 | 4,933.4 | 5,301.4 | 6,857.5 | 7,424.4 | 8,636.8 | 10,047.2 | 11,687.9 | 13,596.6 |
| Total Cash, percent | .0 | .0 | .0 | .0 | .0 | .0 | .0 | .0 | .0 | .0 |
| Account Receivables | 1,649.8 | 2,364.0 | 2,240.1 | 2,569.4 | 3,363.8 | 3,613.2 | 4,203.3 | 4,889.7 | 5,688.2 | 6,617.1 |
| Account Receivables, % | 19.31 | 21.65 | 17.76 | 23.51 | 22.74 | 20.99 | 20.99 | 20.99 | 20.99 | 20.99 |
| Inventories | 1,386.3 | 2,835.8 | 2,812.6 | 2,569.3 | 3,005.2 | 3,728.6 | 4,337.5 | 5,045.8 | 5,869.8 | 6,828.4 |
| Inventories, % | 16.22 | 25.97 | 22.3 | 23.51 | 20.31 | 21.66 | 21.66 | 21.66 | 21.66 | 21.66 |
| Accounts Payable | 1,193.2 | 1,692.2 | 1,388.0 | 1,567.0 | 1,869.3 | 2,321.5 | 2,700.6 | 3,141.6 | 3,654.7 | 4,251.5 |
| Accounts Payable, % | 13.97 | 15.5 | 11.01 | 14.34 | 12.63 | 13.49 | 13.49 | 13.49 | 13.49 | 13.49 |
| Capital Expenditure | -624.7 | -542.0 | -432.5 | -437.8 | -488.5 | -792.1 | -921.5 | -1,072.0 | -1,247.1 | -1,450.7 |
| Capital Expenditure, % | -7.31 | -4.96 | -3.43 | -4.01 | -3.3 | -4.6 | -4.6 | -4.6 | -4.6 | -4.6 |
| Tax Rate, % | 16.76 | 16.76 | 16.76 | 16.76 | 16.76 | 16.76 | 16.76 | 16.76 | 16.76 | 16.76 |
| EBITAT | 1,410.5 | 1,322.0 | 1,506.8 | 1,763.7 | 2,367.8 | 2,505.4 | 2,914.6 | 3,390.5 | 3,944.2 | 4,588.3 |
| Depreciation | ||||||||||
| Changes in Account Receivables | ||||||||||
| Changes in Inventories | ||||||||||
| Changes in Accounts Payable | ||||||||||
| Capital Expenditure | ||||||||||
| UFCF | -910.1 | -689.2 | 1,130.9 | 1,671.6 | 1,212.7 | 1,512.3 | 1,545.0 | 1,797.3 | 2,090.8 | 2,432.3 |
| WACC, % | 9.05 | 9.06 | 9.05 | 9.05 | 9.04 | 9.05 | 9.05 | 9.05 | 9.05 | 9.05 |
| PV UFCF | ||||||||||
| SUM PV UFCF | 7,127.8 | |||||||||
| Long Term Growth Rate, % | 3.00 | |||||||||
| Free cash flow (T + 1) | 2,505 | |||||||||
| Terminal Value | 41,413 | |||||||||
| Present Terminal Value | 26,854 | |||||||||
| Enterprise Value | 33,982 | |||||||||
| Net Debt | -3,333 | |||||||||
| Equity Value | 37,315 | |||||||||
| Diluted Shares Outstanding, MM | 1,194 | |||||||||
| Equity Value Per Share | 31.24 |
Your Benefits
- Adjustable Forecast Parameters: Effortlessly modify assumptions (growth %, profit margins, WACC) to explore various scenarios.
- Comprehensive Data: Hangzhou Greatstar Industrial Co., Ltd’s financial information pre-loaded to streamline your analysis.
- Automated DCF Calculations: The template computes Net Present Value (NPV) and intrinsic value automatically for you.
- Professional and Customizable: A refined Excel model tailored to meet your valuation requirements.
- Designed for Analysts and Investors: Perfect for testing forecasts, assessing strategies, and enhancing efficiency.
Key Features
- Comprehensive DCF Calculator: Features both unlevered and levered DCF valuation models tailored for Hangzhou Greatstar Industrial Co., Ltd (002444SZ).
- WACC Calculation Tool: Pre-configured Weighted Average Cost of Capital spreadsheet with options for custom inputs.
- Customizable Forecast Inputs: Adjust growth projections, capital expenditures, and discount rates as needed.
- Integrated Financial Ratios: Examine profitability, leverage, and efficiency ratios specific to Hangzhou Greatstar Industrial Co., Ltd (002444SZ).
- Visual Dashboard and Charts: Graphical representations that summarize essential valuation metrics for straightforward analysis.
How It Functions
- Step 1: Download the Excel spreadsheet.
- Step 2: Review the pre-filled data for Hangzhou Greatstar Industrial Co., Ltd (002444SZ).
- Step 3: Modify key assumptions (highlighted in yellow) based on your analysis.
- Step 4: Observe the automatic recalculations for the intrinsic value of Hangzhou Greatstar Industrial Co., Ltd (002444SZ).
- Step 5: Utilize the results for investment decisions or reporting.
Why Choose Greatstar's Financial Tool?
- Precision: Rely on authentic Greatstar financial data for precise results.
- Adaptability: Tailored for users to experiment with and adjust inputs as needed.
- Efficiency: Eliminate the complexities of creating a financial model from the ground up.
- Expert-Level: Crafted with the accuracy and usability considerations of top industry professionals.
- Intuitive: Simple interface designed for users of all skill levels, regardless of financial modeling background.
Who Can Benefit from This Product?
- Institutional Investors: Develop comprehensive and trustworthy valuation models for analyzing portfolios featuring Hangzhou Greatstar Industrial Co., Ltd (002444SZ).
- Corporate Finance Departments: Evaluate various valuation scenarios to inform strategic decisions within the company.
- Financial Consultants and Advisors: Deliver precise valuation insights for clients investing in Hangzhou Greatstar Industrial Co., Ltd (002444SZ).
- Academics and Students: Utilize authentic market data to enhance learning and practice in financial modeling.
- Industry Analysts: Gain a deeper understanding of how industrial companies like Hangzhou Greatstar Industrial Co., Ltd (002444SZ) are valued in the marketplace.
What the Template Contains
- Historical Data: Comprehensive overview of Hangzhou Greatstar Industrial Co., Ltd's past financials and foundational forecasts.
- DCF and Levered DCF Models: In-depth templates designed to calculate the intrinsic value of Hangzhou Greatstar Industrial Co., Ltd (002444SZ).
- WACC Sheet: Pre-configured calculations for Weighted Average Cost of Capital.
- Editable Inputs: Adjust essential factors such as growth rates, EBITDA percentages, and CAPEX assumptions.
- Quarterly and Annual Statements: A thorough analysis of Hangzhou Greatstar Industrial Co., Ltd's financial performance.
- Interactive Dashboard: Dynamically visualize valuation outcomes and forecasts.
Disclaimer
All information, articles, and product details provided on this website are for general informational and educational purposes only. We do not claim any ownership over, nor do we intend to infringe upon, any trademarks, copyrights, logos, brand names, or other intellectual property mentioned or depicted on this site. Such intellectual property remains the property of its respective owners, and any references here are made solely for identification or informational purposes, without implying any affiliation, endorsement, or partnership.
We make no representations or warranties, express or implied, regarding the accuracy, completeness, or suitability of any content or products presented. Nothing on this website should be construed as legal, tax, investment, financial, medical, or other professional advice. In addition, no part of this site—including articles or product references—constitutes a solicitation, recommendation, endorsement, advertisement, or offer to buy or sell any securities, franchises, or other financial instruments, particularly in jurisdictions where such activity would be unlawful.
All content is of a general nature and may not address the specific circumstances of any individual or entity. It is not a substitute for professional advice or services. Any actions you take based on the information provided here are strictly at your own risk. You accept full responsibility for any decisions or outcomes arising from your use of this website and agree to release us from any liability in connection with your use of, or reliance upon, the content or products found herein.